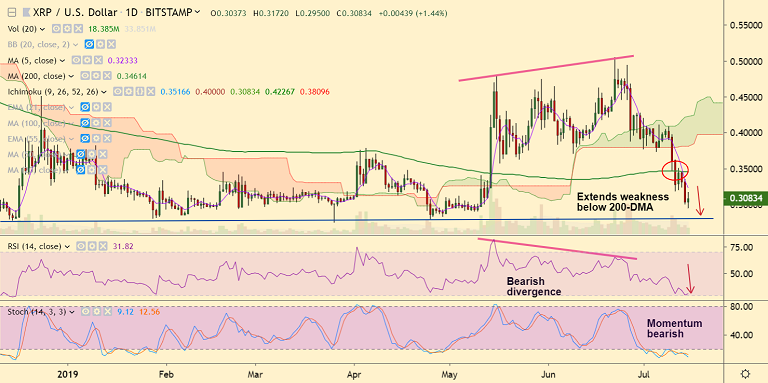
XRP/USD chart - Trading View
Exchange - Bitstamp
Support: 0.28 (Trendline); Resistance: 0.3231 (5-DMA)
Technical Analysis: Bias Bearish
XRP/USD is extending weakness below 200-DMA, bias is bearish.
The pair has hit new 2-month lows at 0.2950, scope for further downside.
Momentum studies are highly bearish and bearish divergence on RSI and Stochs likely to plummet prices further.
GMMA indicator shows shift in trend with shorter-term moving averages slipping below longer-term moving averages.
The pair has closed below 20W SMA and volatility is rising. Next major support lies at 0.28 (trendline).
Break below will see dip till lower Bollinger band (weekly) at 0.2441. Retrace above 200-DMA to see minor upside.
For details on FxWirePro's Currency Strength Index, visit http://www.fxwirepro.com/currencyindex.



FxWirePro: USD/CAD bulls continue to hold the higher ground
FxWirePro: USD/CNY bears maintain upper hand
FxWirePro: GBP/USD edged higher as hopes for US-Iran deal boost riskier assets
FxWirePro- Major Pair levels and bias summary
FxWirePro- Major Crypto levels and bias summary
USD/CHF Smashes Higher to 0.7899 on Dollar Dominance—Bulls Bet on 0.7865 Dips for 0.8000 Breakout
FxWirePro- Major Crypto levels and bias summary
FxWirePro: GBP/AUD downside pressure builds, key support level in focus
Bitcoin Buckles at $73,500: Middle East Tensions and Weak Institutional Demand Set Bearish EMA Stack on $70K Collision Course
Ethereum Cracks Below $2,000 as Bitcoin Contagion Bites—Bearish EMA Stack Sets Sights on $1,700
FxWirePro- Major Crypto levels and bias summary
FxWirePro: GBP/NZD slide extends ,eyes 2.2600 level
FxWirePro: USD/ZAR sell bias remains below key resistance zone 


