


 FxWirePro:EUR/NZD stuck In narrow ranges, focus on near term support
  FxWirePro:EUR/NZD dips below lower range, bearish bias increases
  FxWirePro- Major Pair levels and bias summary
  FxWirePro: USD/ZAR advances as South African rand weakens amid renewed Middle East tensions
  GBPJPY Bullish Surge: Strong Pound Ignites Fresh Upside on Fed-BOE Policy Divergence as All EMAs Align
  FxWirePro: AUD/ USD eases as risk sentiment remains fragile
  FxWirePro: GBP/NZD downtrend loses steam, remains on bearish path
  Major Pair Action Bias: NZDUSD Turns Bullish While Other Majors Stay Neutral
  FxWirePro- Woodies pivot (Major)
  NZDJPY Bullish Surge: Strong Kiwi Ignites Fresh Upside as 94 Support Holds and All EMAs Align
  NZDJPY Bullish Setup: Buy Dips at 94.50 as Uptrend Holds Above All Key EMAs
  FxWirePro: AUD/USD edges lower, but bullish outlook persists
  Major Pair Action Bias: Extremely Bullish Surge Powers GBPUSD & NZDUSD as Bullish Momentum Ignites
  FxWirePro- Major Crypto levels and bias summary
  Gold Loses Steam After Strong U.S. Retail Sales
  FxWirePro: USD/JPY uptrend loses steam, remains on bullish path


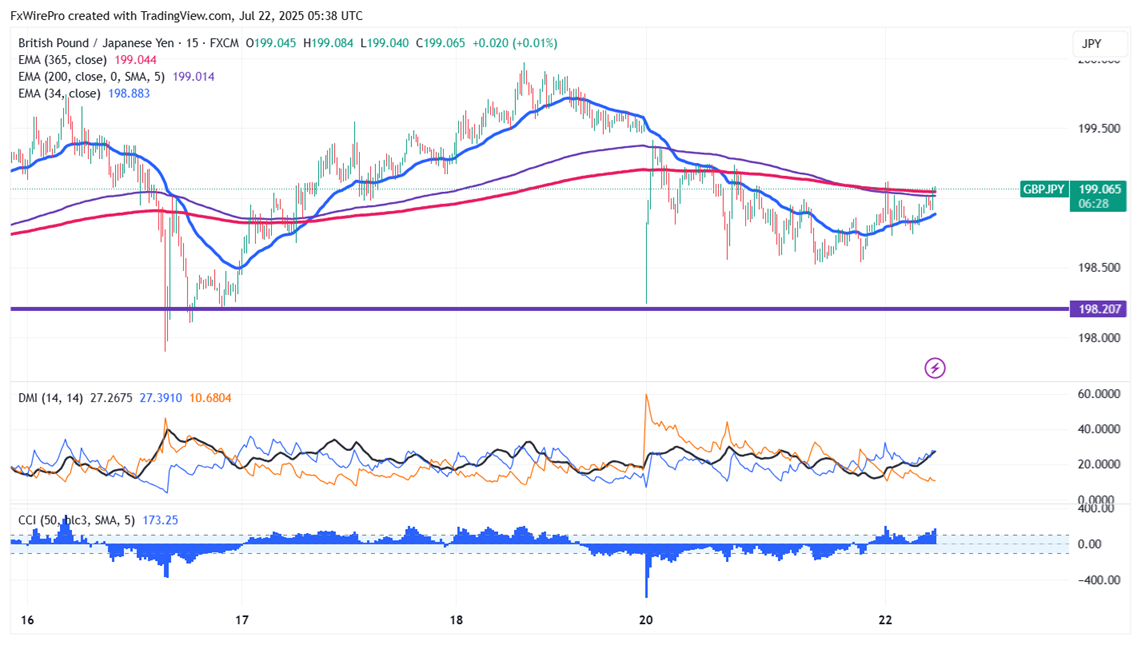
The GBP/JPY gained after forming a double bottom near 198.50. It hit an intraday high of 199.07 and is currently trading around 199.063. Intraday trend is bullish as long as support 197.85 holds.
‘The GBP/JPY pair is trading above 55 and 200 EMA (Short-term) and 365 EMA (long-term) on the 15-minute chart, confirming a bullish trend. Any violation below 198.50 indicates the intraday trend is weak. A dip to 198/197.70/196.70/196.25/195.25/194/193.70 is possible. Immediate resistance is at 199.20 a breach above this level targets of 200/202/204.
Market Indicators (15 min chart)
CCI (50)- Bullish
Directional movement index - Bullish
Trading Strategy: Buy
It Is good to buy on dips around 198. 95-99 with SL around 198.40 for a TP of 202.


