


 FxWirePro- Major Crypto levels and bias summary
  BTC’s Bear Bounce: Sell the Rally Near $66K as Bears Target $59K–$52K Breakdown


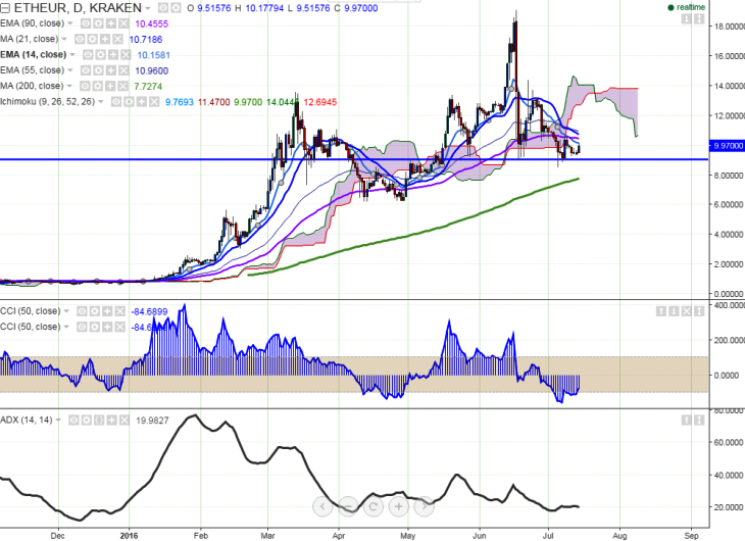
ETH/EUR is seen trading on Thursday above in green. The pair has slightly recovered after making a low of 9.26 levels (KRAKEN) on Jul 11th, 2016. It is currently trading at 9.90 at the time of writing.
Ichimoku analysis of daily chart shows:
Tenkan-Sen level: 9.59
Kijun-Sen level: 10.46
Trend reversal level - (90 4H MA) – 10.46
Long-term trend remains to be bullish. Short term seems to be bearish. In daily chart, ETH/EUR is struggling to break above 14 days EMA .Any further bullishness only above that level.
Major resistance is seen at 10.18 (14 days EMA) and any break above that level will take the pair till 10.72 (38.2% retracement of 14.38 and 8.55)/10.99 (55 days EMA). Short term support can be noticed at 8.56 (May 14th low) and any violation below will drag the pair till 8 (May 6th low)/7.44 (200 day MA).

- News

- Economy

- Central Banks
- Investing
- Research
- Roundups
- Digital Currency
- Insights
- Technical Analysis
- Technology
- Business
- Law
- Health
- Nature
- Fintech
- Science
- Topic
- Opinions
- ©Econometrics LLC . All Rights Reserved.
ETH/EUR struggles to close above 14-day EMA, decline till 7.36 likely
Thursday, July 14, 2016 12:52 PM UTC
Editor's Picks


- Market Data
Most Popular


