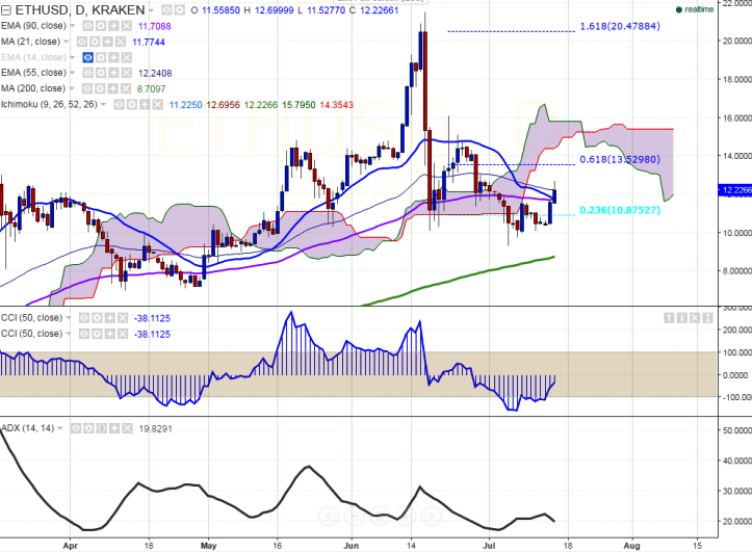
ETH/USD faces strong resistance at 12.69, break above targets 13.52
ETH/USD has broken major resistance 11.69 and jumped till 12.69 at the time of writing. It is currently trading around 11.60 (Kraken). Long-term trend: Bullish Short-term trend: Bullish Ichimoku analysis (Daily chart): T…
ETH/USD has broken major resistance 11.69 and jumped till 12.69 at the time of writing. It is currently trading around 11.60 (Kraken).
Long-term trend: Bullish
Short-term trend: Bullish
Ichimoku analysis (Daily chart):
Tenkan-Sen: 10.76
Kijun-Sen: 12.69
Trend reversal: 11.69
“In daily chart, the pair is facing resistance around 12.69 (daily Kijun-Sen) and it should break above for further bullishness”, FxWirePro said in a statement.
Major resistance is seen at 12.69 (daily Kijun-Sen) and any break above targets 13.02/13.52 (61.8% retracement of 16.08 and 9.30). Major support is around 10.00 and break below targets 9.30 (Jul 5 low)/ 8.45 (127.2% retracement of 10.10 and 16.08).
The $0.131 mark was the late-September high; a revisit would depend on Bitcoin (BTC) strengthening and crypto-market sentiment improving. No timeframe was given.