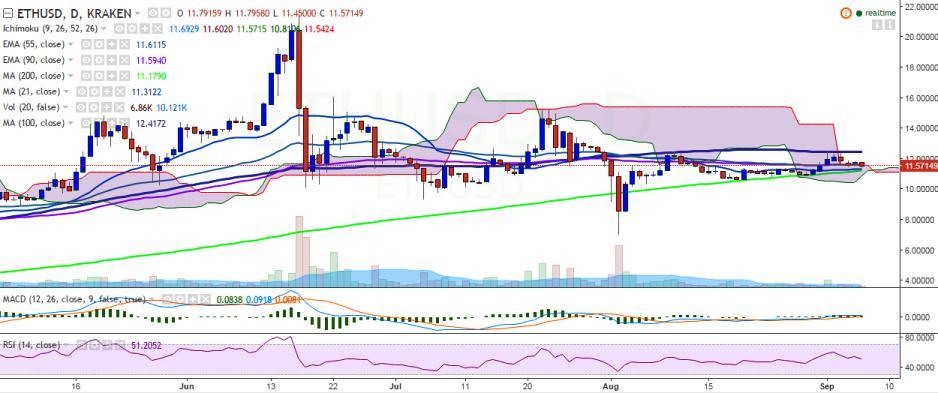
ETH/USD retreats from higher levels, slight dip till 11.00 likely
ETH/USD is trading in the red on Tuesday and has slipped below 90 EMA. It is currently trading at 11.57 levels at the time of writing (Kraken). Long-term trend: Bullish Short-term trend: weak Ichimoku analysis of daily c…
By Shampa Mani
Updated 1 min read
Image from the original EconoTimes article
ETH/USD is trading in the red on Tuesday and has slipped below 90 EMA. It is currently trading at 11.57 levels at the time of writing (Kraken).
Long-term trend: Bullish
Short-term trend: weak
Ichimoku analysis of daily chart:
Tenkan Sen: 11.69
Kijun Sen: 11.60
Trend reversal: 11.59 (90 EMA)
“The pair seems to have lost upward momentum after hitting 12.54 levels. A close below 90 EMA would see a slight dip till 11.00 levels”, FxWirePro said in a statement.
On the upside, the pair will run into resistance at 12.42 (100-day MA) and a break above would target 13.47 (78.6% retracement of 15.23 and 7.00)/15.23 (July 22 high).
On the flipside, support is seen at 11.14 (200-day MA) and a break below would the pair to 10.00 (psychological level) and then to 9.77(50% retracement of 7 and 12.54).
The $1.000312 trillion market estimate is dated Sept. 30, 2025; a Senate proposal would direct revaluation proceeds toward Bitcoin purchases and public debt.