


 BTC’s Bear Bounce: Sell the Rally Near $66K as Bears Target $59K–$52K Breakdown
  FxWirePro- Major Crypto levels and bias summary
  FxWirePro- Major Crypto levels and bias summary
  FxWirePro- Major Crypto levels and bias summary
  FxWirePro- Major Crypto levels and bias summary


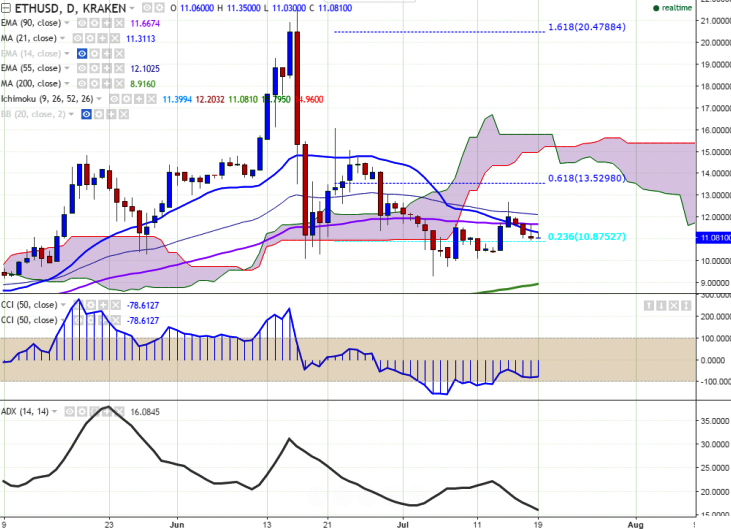
ETH/USD traded in a narrow range on Tuesday between 11.03 and 11.35 levels. It currently trades at 11.08 levels at the time of writing (Kraken).
Ichimoku analysis of daily chart:
Tenkan Sen: 11.39
Kijun Sen: 12.20
Trend reversal – 11.67 (90 EMA)
“ETH/USD has declined sharply after making a high of 12.69 on Friday. In daily chart, the pair is facing resistance around 11.67 (90 day EMA) and it should break above for further bullishness”, FxWirePro said in a statement.
Major resistance is seen around 11.69 (90 day EMA) and any break above targets 12.15 (55 day EMA)/12.69 (Jul 15 high). On the other hand, major support is likely to be found at 10 and break below targets 9.30 (Jul 5 low)/ 8.45 (127.2% retracement of 10.10 and 16.08).

- News

- Economy

- Central Banks
- Investing
- Research
- Roundups
- Digital Currency
- Insights
- Technical Analysis
- Technology
- Business
- Law
- Health
- Nature
- Fintech
- Science
- Topic
- Opinions
- ©Econometrics LLC . All Rights Reserved.
ETH/USD trades rangebound, bullishness only above 90 EMA
Tuesday, July 19, 2016 12:31 PM UTC
Editor's Picks


- Market Data
Most Popular


