


 FxWirePro- Major Crypto levels and bias summary
  FxWirePro- Major Crypto levels and bias summary
  BTC’s Bear Bounce: Sell the Rally Near $66K as Bears Target $59K–$52K Breakdown
  FxWirePro- Major Crypto levels and bias summary


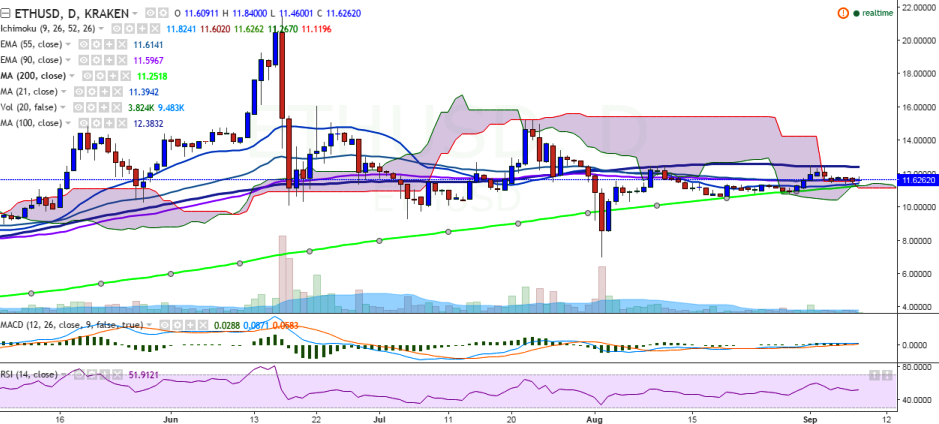
ETH/USD has considerably weakened in the past couple of days after hitting 12.54 levels. The pair has slipped below 90 EMA and is currently trading at 11.46 levels, at the time of writing (Kraken).
Ichimoku analysis of daily chart:
Tenkan Sen: 11.75
Kijun Sen: 11.60
Trend reversal: 11.59 (90 EMA)
“The has broken below 90 EMA and is trading in the red. Short-term trend appears weak for the pair and a close below 200-day MA would confirm further bearishness”, FxWirePro said in a statement.
On the top side, major resistance is seen at 12.40 (100-day MA) and a break above would target 13.47 (78.6% retracement of 15.23 and 7.00)/15.23 (July 22 high).
On the other hand, support is likely to be found at 11.21 (200-day MA) and a close below would see the pair falling to 10.00 (psychological level) and then to 9.77(50% retracement of 7 and 12.54).

- News

- Economy

- Central Banks
- Investing
- Research
- Roundups
- Digital Currency
- Insights
- Technical Analysis
- Technology
- Business
- Law
- Health
- Nature
- Fintech
- Science
- Topic
- Opinions
- ©Econometrics LLC . All Rights Reserved.
ETH/USD trades weak, break below 200-day MA confirms further bearishness
Thursday, September 8, 2016 10:57 AM UTC
Editor's Picks


- Market Data
Most Popular


