


 FxWirePro- Major Crypto levels and bias summary
  FxWirePro- Major Crypto levels and bias summary
  Ethereum Cracks Under $1,700: Sell the Rally Near $1,750 as Bears Eye $1,380–$1,200
  FxWirePro- Major Crypto levels and bias summary


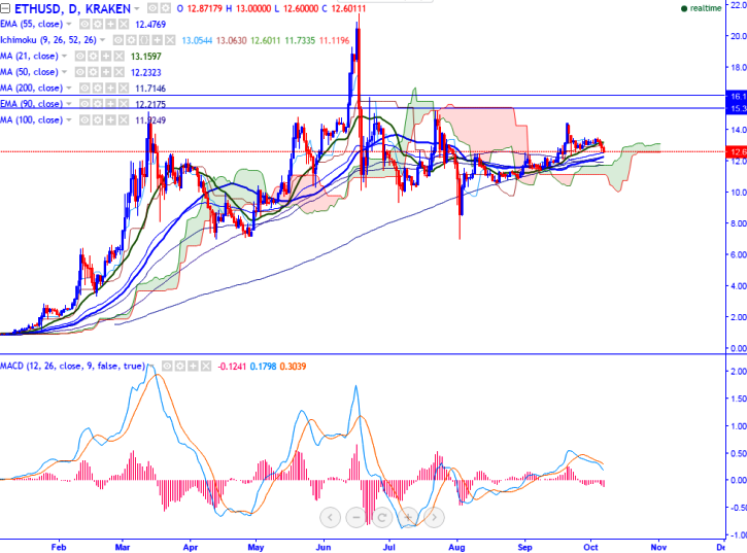
ETH/USD is seen trading well below on Friday. The pair has retreated after jumping till $13.21 (KRAKEN). It is currently trading around $12.87 at the time of writing.
Ichimoku analysis of daily chart shows:
Tenkan-Sen $13.07
Kijun-Sen $13.04
Trend reversal - $11.77 (90 days EMA)
Long-term trend remains to be neutral. In a daily chart, the pair is trading well below 21- day MA and a slight decline till 12/11.77 likely.
Major resistance is seen at $13.15 (21 day MA) and any break above targets $13.50 (Sep 29th high)/$14.45 (Sep 20th 2016). Major support is around $12.47 (55 day EMA) and break below targets $12.19 (50 –day MA)/ $11.70 (200- day MA).

- News

- Economy

- Central Banks
- Investing
- Research
- Roundups
- Digital Currency
- Insights
- Technical Analysis
- Technology
- Business
- Law
- Health
- Nature
- Fintech
- Science
- Topic
- Opinions
- ©Econometrics LLC . All Rights Reserved.
ETH/USD trades well below 21- day MA, targets $11.71
Friday, October 7, 2016 12:07 PM UTC
Editor's Picks


- Market Data
Most Popular


