


 FxWirePro- Major Crypto levels and bias summary
  FxWirePro- Major Crypto levels and bias summary
  Ethereum Cracks Under $1,700: Sell the Rally Near $1,750 as Bears Eye $1,380–$1,200
  FxWirePro- Major Crypto levels and bias summary


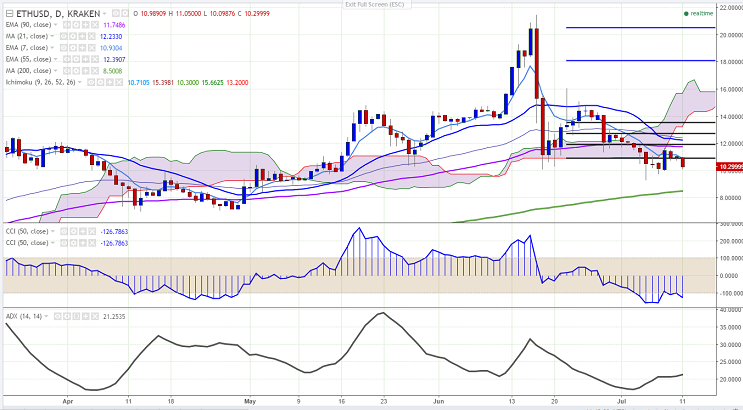
ETH/USD traded in the red on Monday, hovering near the $10 mark. It hit 11.05 levels and could not sustain its strength. It currently trades at 10.22 levels (Kraken) at the time of writing.
Ichimoku analysis of daily chart shows:
Tenkan Sen: 10.71
Kijun Sen: 15.39
Trend reversal: 11.78 (90 EMA)
The pair has fallen drastically after making a high of 16.08 levels (June 22) and is trading well below 90 EMA. Short-term trend, therefore, appears bearish for the pair.
Major resistance is seen at 11.78 (90-day EMA) and any break above confirms minor bullishness, a jump till 12.56 (55-day EMA)/13.55 (61.8% retracement of 16.08 and 8.55). On the other hand, major support is likely to be found at 9.30 (Jul 5 low) and break below targets 8.45 (200-day MA)/8.

- News

- Economy

- Central Banks
- Investing
- Research
- Roundups
- Digital Currency
- Insights
- Technical Analysis
- Technology
- Business
- Law
- Health
- Nature
- Fintech
- Science
- Topic
- Opinions
- ©Econometrics LLC . All Rights Reserved.
ETH/USD trades well below 90 EMA, targets 9.30
Monday, July 11, 2016 12:15 PM UTC
Editor's Picks


- Market Data
Most Popular


