


 BTC’s Bear Bounce: Sell the Rally Near $66K as Bears Target $59K–$52K Breakdown
  FxWirePro- Major Crypto levels and bias summary
  FxWirePro- Major Crypto levels and bias summary
  Ethereum Cracks Under $1,700: Sell the Rally Near $1,750 as Bears Eye $1,380–$1,200


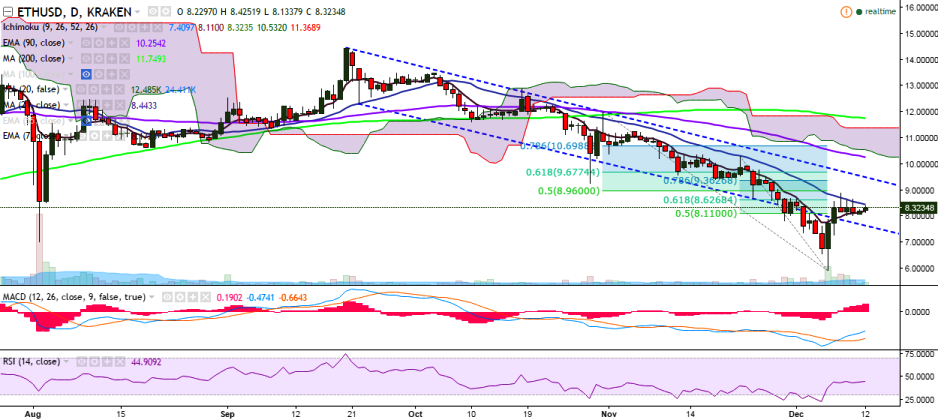
ETH/USD is trading in a narrow range between 7-EMA and 21-day MA from past few days. It is currently trading at 8.32 levels (Kraken).
Ichimoku analysis (Daily chart):
Tenkan-Sen: 7.40
Kijun-Sen: 8.14
Trend reversal: 10.29 (90-EMA)
On the topside, the pair faces strong resistance at 8.50 (21-day MA) and a break above would target 8.89 levels (December 08 high)/9.36 (78.6% retracement of 10.30 and 5.92). Minor bullishness in the pair could be seen only if it breaks above 9.50 levels (trend line joining 14.45 and 12).
On the reverse side, the pair has taken support at 8.12 (7-EMA) and a break below 7.65 (trend line joining 12.30 and 8.67) would drag it to 7.40 (50% retracement of 5.92 and 8.89)/7 (August 02 low).

- News

- Economy

- Central Banks
- Investing
- Research
- Roundups
- Digital Currency
- Insights
- Technical Analysis
- Technology
- Business
- Law
- Health
- Nature
- Fintech
- Science
- Topic
- Opinions
- ©Econometrics LLC . All Rights Reserved.
ETH/USD upside capped by 21-DMA, minor bullishness only above 9.50
Monday, December 12, 2016 11:28 AM UTC
Editor's Picks


- Market Data
Most Popular


