


 FxWirePro- Major Crypto levels and bias summary
  FxWirePro- Major Crypto levels and bias summary
  ETHUSD Surges Past $2700 on Strong Institutional Demand, Technicals Show Bullish Crossover Despite Cooling ETF Inflow Momentum
  Bitcoin Surges Past $85,000 Amidst Rising Risk Appetite
  FxWirePro-24-Hour Crypto Category-Based Performance Dashboard


 Add as a preferred source on Google
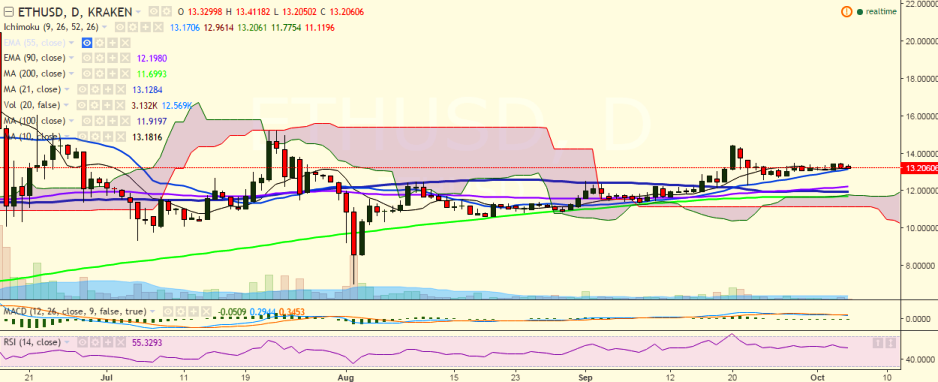
ETH/USD is showing a dip after hitting 13.50 levels on Tuesday. It is currently trading at 13.24 levels (Kraken).
Long-term trend: Bullish
Ichimoku analysis of daily chart:
Tenkan Sen: 13.10
Kijun Sen: 12.92
Trend reversal: 12.17 (90 EMA)
“The pair’s upside is being capped by 13.62 (61.8% retracement of 14.45 and 12.30), and the pair must break above this level for further bullishness”, FxWirePro said in a statement.
On the upside, the pair is facing strong resistance at 13.50 levels (October 04 high) and a break above would target 13.62 (61.8% retracement of 14.45 and 12.30) 14.45 levels (September 20 high)/15.23 (July 22 high).
On the other hand, the pair is likely to find support near 13.16 (10-DMA) and a break below would see the pair testing 13.00 levels. Further weakness would drag it to 12.50 (psychological level).

- News

- Economy

- Central Banks
- Investing
- Research
- Roundups
- Digital Currency
- Insights
- Technical Analysis
- Technology
- Business
- Law
- Health
- Nature
- Fintech
- Science
- Topic
- Opinions
- ©Econometrics LLC . All Rights Reserved.
ETH/USD upside capped by 61.8% Fib, break above confirms bullishness
Wednesday, October 5, 2016 11:16 AM UTC
Editor's Picks



- Market Data
Most Popular




