


 Crypto Alpha Command: BTC & ETH derivatives Intelligence
  FxWirePro- Major Crypto levels and bias summary
  ETHUSD Surges Past $2700 on Strong Institutional Demand, Technicals Show Bullish Crossover Despite Cooling ETF Inflow Momentum
  FxWirePro-24-Hour Crypto Category-Based Performance Dashboard
  Bitcoin Surges Past $85,000 Amidst Rising Risk Appetite


 Add as a preferred source on Google
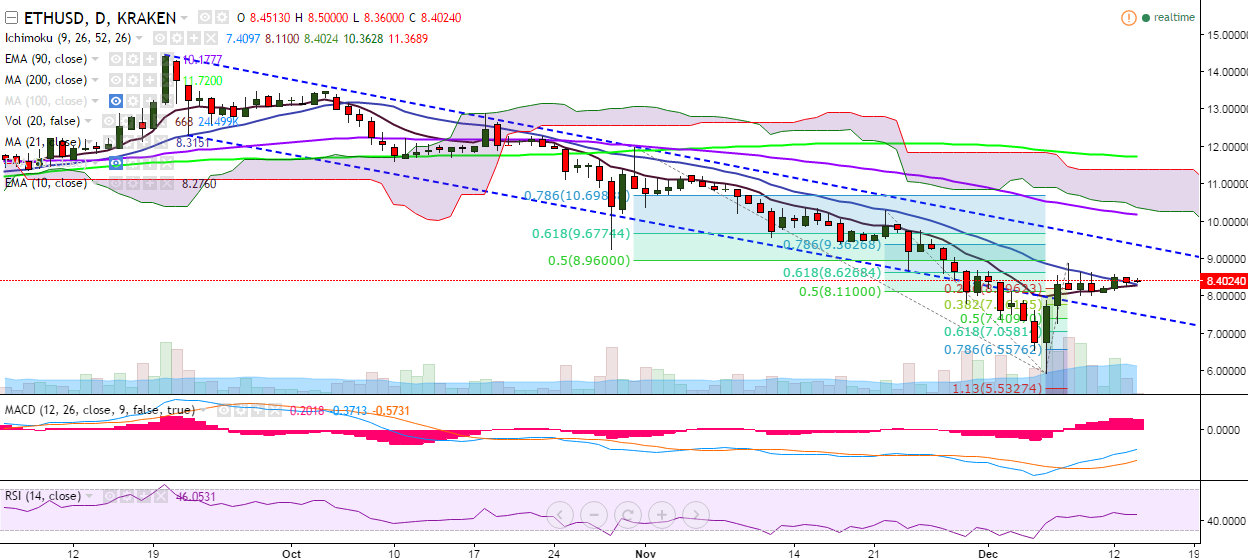
ETH/USD upside continues to be capped by 61.8% fib and is currently trading at 8.40 levels at the time of writing (Kraken).
Ichimoku analysis (Daily chart):
Tenkan-Sen: 7.40
Kijun-Sen: 8.11
Trend reversal: 10.21 (90-EMA)
The pair is facing strong resistance at 8.62 (61.8% retracement of 10.30 and 5.92) and a consistent break above would see it testing 8.89 (December 08 high)/9.00. Minor bullishness in the pair could be confirmed only if it breaks above 9.36 levels (trend line joining 14.45 and 12).
On the reverse side, the pair is trading just above 21-day MA, while 8.24 (10-EMA) has been acting as a major support. A break below this level would target 8.00 (December 09 low)/ 7.76 (38.2% retracement of 5.92 and 8.89). A break below 7.52 (trend line joining 12.30 and 8.67) would confirm further bearishness in the pair, dragging it to 7 (August 02 low).

- News

- Economy

- Central Banks
- Investing
- Research
- Roundups
- Digital Currency
- Insights
- Technical Analysis
- Technology
- Business
- Law
- Health
- Nature
- Fintech
- Science
- Topic
- Opinions
- ©Econometrics LLC . All Rights Reserved.
ETH/USD upside capped by 61.8% fib, break above 8.89 targets 9.36
Wednesday, December 14, 2016 7:23 AM UTC
Editor's Picks



- Market Data
Most Popular




