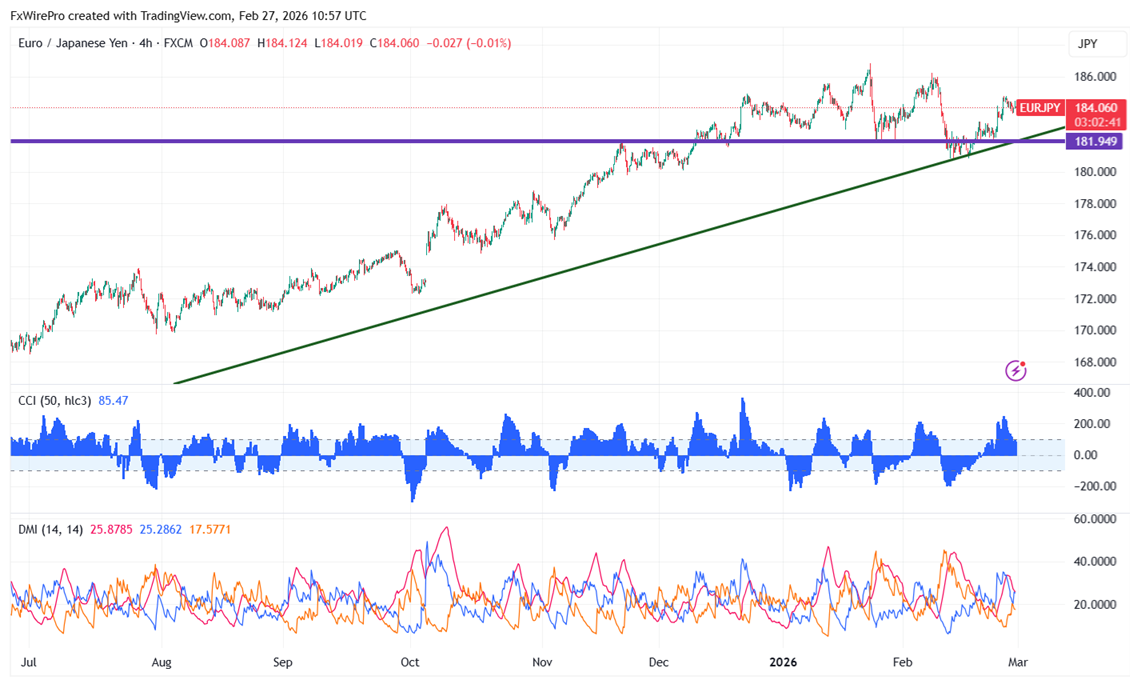
EURJPY has traded in a narrow range between 184.71 and 183.90 for the past two days. It is still bullish as long as it is over 183.20 pairs. It now hovers around 184.04 after hitting an intraday high of 184.07.
Technical Analysis:
The EUR/JPY pair is above the 55 EMA, 200 EMA, and 365-H EMA on the 4-hour chart.
- Near-Term Resistance: Around 185. A breakout here could target 186/187/188.69.
- Immediate Support: At 183.20, if breached, the pair could fall to 182.80/182.48/181.80/180.80/180.
Indicator Analysis (4- hour chart):
- CCI (50): Bullish
- Average Directional Movement Index: Neutral
Overall, the indicators suggest a bullish trend
Trading Recommendation:
It is good to buy on dips around 183.18-20 with a SL around 182.48 for a TP of 186.



FxWirePro: GBP/USD recovers some ground but bears are not done yet
FxWirePro: USD/ZAR sell bias remains below key resistance zone
FxWirePro: GBP/AUD downside pressure builds, key support level in focus
FxWirePro: NZD/USD gains as hawkish RBNZ comments boost Kiwi dollar
FxWirePro: USD/CAD bulls continue to hold the higher ground
FxWirePro- Major Pair levels and bias summary
FxWirePro: GBP/NZD slide extends ,eyes 2.2600 level
FxWirePro- Major Pair levels and bias summary
FxWirePro: USD/CAD slips as Canadian dollar firms on hopes for US-Iran ceasefire deal
FxWirePro- Major Crypto levels and bias summary
FxWirePro: GBP/NZD extends decline , vulnerable to more downside
FxWirePro- Major Crypto levels and bias summary
FxWirePro- Woodies pivot (Major)
FxWirePro: USD/JPY edges higher but bulls lack punch
Pound-Yen Roars Back Above 214: Bulls Reload for 216–217 Charge on Dip-Buying Setup 


