


 Best Gold Stocks to Buy Now: AABB, GOLD, GDX
  Gold Prices Fall Amid Rate Jitters; Copper Steady as China Stimulus Eyed


 - EconoTimes)


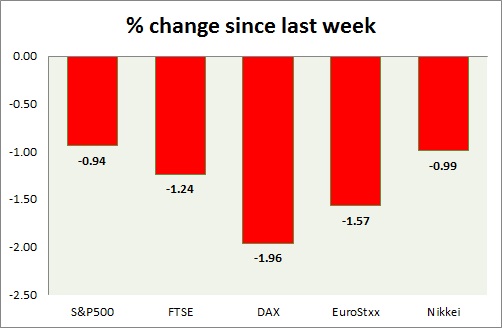
Equities are all red in today's trading. Kindly note all instruments mentioned here are CFDs, whose values might differ from cash or future traded. Performance this week at a glance in chart & table -
S&P 500 -
- S&P 500, dropped sharply as oil price reversed gains over Naimi's comments. !900 area providing some support. Today's range 1899-1924
- Active call - Sell S&P 500 @ 1890 with stop loss around 1960, targeting 1730 area.
- S&P 500 future is currently trading at 1904. Immediate resistance lies at 1960 and support 1900, 1870.
FTSE -
- FTSE is down as commodities weigh. Today's range 5960-5860.
- Active call - Sell FTSE100 @5890, with stop loss around 6160 area targeting 5200 area.
- FTSE is currently trading at 6010. Immediate support lies at 5500, 5200 and resistance 6150, 6350, 6820.
DAX -
- DAX is down in line with global peers. Today's range 9430-9160.
- DAX is currently trading at 9200. Immediate support lies at, 9000 area and resistance at 10000, 10850 around.
EuroStxx50 -
- Stocks across Europe are down today.
- German DAX is down (-2.2%), France's CAC40 is down (-1.9%), Italy's FTSE MIB is down (-2.4%), Spain's IBEX is down (-2.8%).
- EuroStxx50 is currently trading at 2820, down by -1.85% today. Support lies at 2400 and resistance at 3060.
Nikkei -
- As oil drops, Nikkei has fallen sharply. Today's range 15640-16080
- Nikkei is currently trading at 15670. Immediate support lies at 15000 and resistance at 16500, 18500.
|
S&P500 |
-0.94% |
|
FTSE |
-1.24% |
|
DAX |
-1.96% |
|
EuroStxx50 |
-1.57% |
|
Nikkei |
-0.99% |


