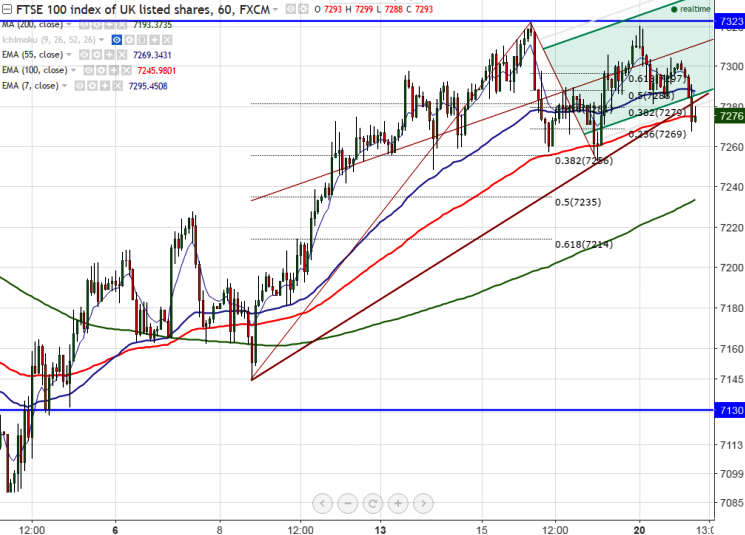
FTSE100 breaks minor trend line support, decline till 7214 likely
Chart pattern formed – Double top Major support - 7280 (trend line joining 7145 and 7253) Major resistance- 7322 FTSE100 has formed a temporary top around 7322 and started to decline from that level. It is currently trad…
Major support - 7280 (trend line joining 7145 and 7253)
Major resistance- 7322
FTSE100 has formed a temporary top around 7322 and started to decline from that level. It is currently trading around 7275.
On the lower side, next immediate support is at 7253 low formed on Feb 17th 2017 and any violation below will drag the index down till 7230 (200- H MA)/7214 (61.8% retracement of 7152 and 7322)/7152 (Feb 8th 2017 low).
Any break above temporary top at 7322 confirms further bullishness , a jump till 7369 (161.8% retracement of 7322 and 7253)/7400.
It is good to sell on rallies around 7285-7290 with SL around 7325 for the TP of 7232/7214/7155