


 Oil Prices Head for Weekly Surge as Red Sea Attacks and Kazakhstan Supply Cuts Raise Disruption Fears
  Nasdaq Drops as AI Earnings, Oil Surge and Middle East Tensions Weigh on Wall Street
  Wall Street Ends Mixed as Fed Decision, Earnings and Tariffs Keep Investors on Edge
  Trump Says No Decision on Major Iran Strikes as U.S.-Tehran Talks Intensify
  US-Mexico USMCA Talks Advance as Auto Rules Remain Major Sticking Point
  Asian Stocks Rally on AI Spending Optimism as Middle East Tensions Push Oil to Six-Week High
  Iran Rejects U.S.-Backed Ceasefire as Trump Escalates Military Threats, Oil Tops $100
  Houthi Attacks on Saudi Oil Sites Raise Fears of Wider Middle East Conflict Despite U.S. Strike Pause
  Gold Price Holds Above $4,000 as Fed Rate Hike Bets Rise on Oil-Driven Inflation
  Oil Prices Rise as Houthi Attacks on Saudi Tankers Heighten Middle East Supply Fears
  Trump Threatens Iran With 'Major Military Punishment' as Red Sea Attacks Push Oil Above $100
  South Korea Q2 GDP Beats Forecasts as AI Chip Exports Drive Growth
  Japan CPI Rises in June, but Core Inflation Stays Below BOJ’s 2% Target
  US Dollar Posts Best Weekly Gain in Over a Month as Middle East Tensions Boost Safe-Haven Demand
  Gold Price Holds Above $4,130 as Fed Rate Outlook and Middle East Tensions Support Safe-Haven Demand
  Japan Manufacturing Growth Holds Strong in July Despite Middle East Uncertainty


Complexity is all around us, from the daily fluctuations of financial markets to the intricate web of neurons in our brains.
Understanding how the different components of these systems interact with each other is a fundamental challenge for scientists trying to predict their behaviour. Piecing together these interactions is like deciphering a code from an intricate set of clues.
Scientists have developed hundreds of different methods for doing this, from engineers studying noisy radio channels to neuroscientists studying firing patterns in networks of interacting neurons. Each method captures a unique aspect of the interactions within a complex system – but how do we know which method is right for any given system sitting right in front of us?
In new research published in Nature Computational Science, we have developed a unified way to look at hundreds of different methods for measuring interaction patterns in complex systems – and working out which ones are most useful for understanding a given system.
A scientific orchestra
The science of complex systems can be, well, complex. And the science of comparing and combining different ways of studying these systems even more so.
But one way to think about what we’ve done is to imagine each scientific method is a different musical instrument playing in a scientific orchestra. Different instruments are playing different melodies with different tones and in different styles.
We wanted to understand which of our scientific instruments are best suited to solving which types of problems. We also wanted to know whether we could conduct all of the instruments to form a harmonious whole.
By presenting these methods as a full orchestra for the first time, we hoped we would find new ways of deciphering patterns in the world around us.
Hundreds of methods, more than 1,000 datasets
To develop our orchestra, we undertook the mammoth task of analysing more than 200 methods for computing interactions from as many datasets as we could get our hands on. These covered a huge range of subjects, from stock markets and climate to brain activity and earthquakes to river flow and heart beats.
In total, we applied our 237 methods to more than 1,000 datasets. By analysing how these methods behave when applied to such diverse scientific systems, we found a way for them to “play in harmony” for the first time.
In the same way that instruments in an orchestra are usually organised as strings, brass, woodwind and percussion, scientific methods from areas like engineering, statistics and biophysics also have their traditional groupings.
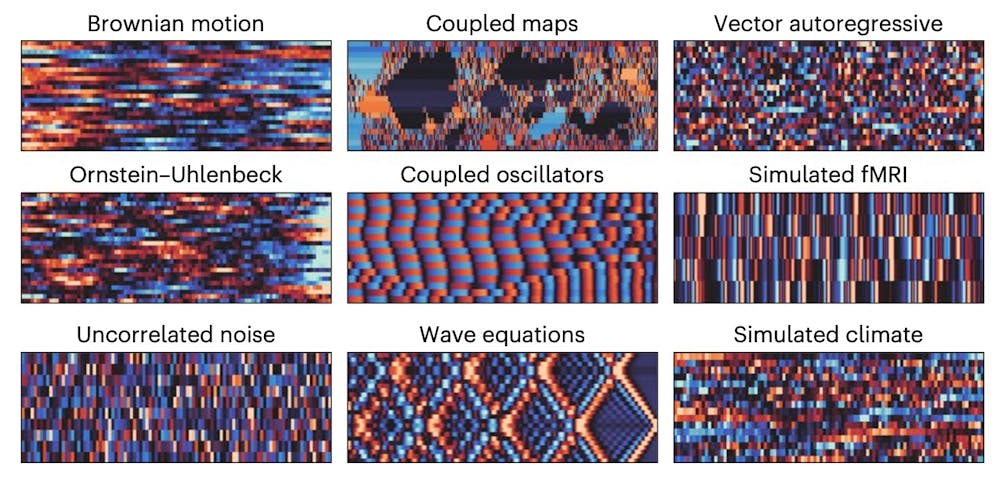
Applying different methods to more than 1,000 datasets from a wide range of fields revealed surprising similarities and differences. Cliff et al. / Nature Computational Science, CC BY-SA
But when we organised our scientific orchestra, we found that the scientific instruments grouped together in a strikingly different way to this traditional organisation. Some very different methods behaved in surprisingly similar ways to one another.
This was a bit like discovering that the tuba player’s melody was surprisingly similar to that of the flute, but no one had noticed it before.
Our weird and wonderful new orchestral layout (which sometimes places cello and trumpet players next to the piccolo player), represents a more “natural” way of grouping methods from all across science. This opens exciting new avenues for cross-disciplinary research.
The orchestra in the real world
We also put our full scientific orchestra to work on some real-world problems to see how it would work. One of these problems was using motion data from a smartwatch to classify activities like “badminton playing” and “running”; another was distinguishing different activities from brain-scan data.
Properly orchestrated, the full ensemble of scientific methods demonstrated improved performance over any single method on its own.
To put it another way, virtuosic solos are not always the best approach! You can get better results when different scientific methods work cooperatively as an ensemble.
The scientific ensemble introduced in this work provides a deeper understanding of the interacting systems that shape our complex world. And its implications are widespread – from understanding how brain communication patterns break down in disease, to developing improved detection algorithms for smartwatch sensor data.
Time will tell what new music scientists will make as they step up to conduct our new scientific orchestra that simultaneously incorporates diverse ways of thinking about the world.


