


 FxWirePro: Daily Commodity Tracker - 21st March, 2022
  Gold Prices Fall Amid Rate Jitters; Copper Steady as China Stimulus Eyed


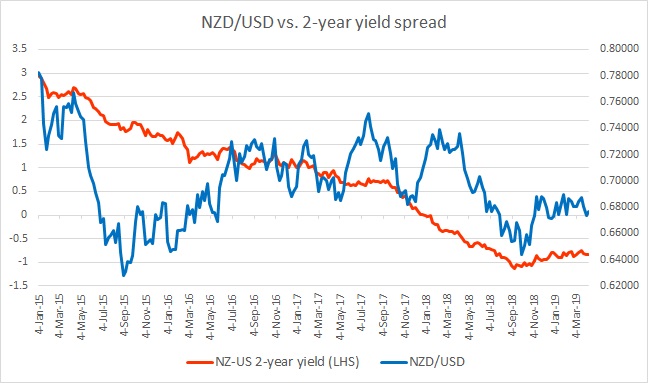
The chart above shows, how the relationship between NZD/USD and 2-year yield divergence has unfolded since 2015.
While the spread has narrowed steadily from +300 basis points (bps) in January 2015 to -106 bps as of September 2018, the New Zealand dollar has been pretty volatile around the spread. However, from the chart, it’s quite clear that the direction of the spread is playing a crucial role over the medium to long term.
We have forecasted a lower NZD against the USD with a target of 0.59 against the USD over the medium to long term, and with the Reserve Bank of New Zealand (RBNZ) continuing its dovish rhetoric, we expect the spread to decline further in favor of the USD.
As the spread started narrowing in favor of the New Zealand dollar since September, the New Zealand dollar has risen against the USD. Since September, the spread has narrowed from -112 bps to -80 bps as of today, as the Kiwi is up from 0.65 area to testing the 0.69 resistance area.
Since then, the spread has not moved much and currently at -84 bps, while the New Zealand dollar is currently trading at 0.676 against the USD.


