


 Gold's 365-Day EMA Streak Since Oct 2023 Faces Its First Real Test at $3,980 — Break or Bounce to $4,140?
  How AI prompting turned writerly description into an everyday skill
  How Donald Trump has changed the way diplomacy is done
  J.P. Morgan Sees Potential Vestas Guidance Upgrade Amid Strong Wind Energy Demand
  Trump’s Iran Strategy: What Has Been Achieved After Three Months of Conflict?
  AI Memory Boom Sparks Global Chip Supply Crunch


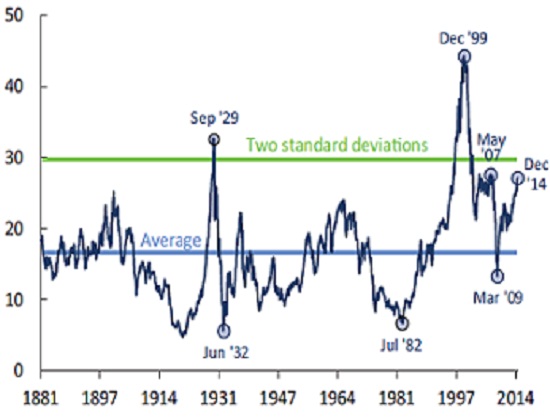
US treasury department's office of financial research issued research report that issues warnings that the stock market might is heading towards a bubble zone and may be ripe for correction. The report evaluates the current stock markets with historical perspective. Chart courtesy OFS and ICIS.
Key highlights -
The chart is included for the report that shows CAPE index, created by Nobel Prize winner Robert Shiller.
- CAPE index is cyclically adjusted Price to earnings ratio and is based on last 10 years of inflation adjusted average earnings.
- CAPE index in all the historical stock market bubble burst was close or beyond its two sigma level from average.
- Currently it is moving close to that two sigma level. As of yesterday the index value stands at 27.7. This not necessarily calls for bust, as price might further inflate. During dot com bubble, Shiller index rose above 40 before breakdown.
Other highlights -
- US corporate profits after tax is at an all-time high compared to Gross national product and at a two sigma level. Corporate profits now at a record 9.4% for the S&P 500, nearly 50% higher than their historical average of 6.3%.
- Corporates have taken up record amount of debt since the crisis. Corporate debt now stands $ 7.4 trillion compared to $5.7 trillion in 2006. Margin debt in New York stock market now stands at record high. This is a contrarian indicator.
US stock might reach further highs if economic outlook improves, however investors should exercise caution as these indicators have proven themselves over and over.


