


 FxWirePro- Major Pair levels and bias summary
  FxWirePro: USD/CNY neutral in the near-term, scope for downward resumption
  Bitcoin’s Volatile Reset: ETFs Rebound as Bulls Eye USD 80,000 Milestone
  FxWirePro: USD/ZAR edges lower ,investors remain on edge
  FxWirePro: GBP/USD biased higher but rally currently stretched
  FxWirePro: USD/JPY holding bid into weekend
  FxWirePro: GBP/NZD up trend gains some momentum but hurdles ahead
  FxWirePro- Major Pair levels and bias summary
  FxWirePro:NZD/USD uptrend loses momentum but bullish setup remains
  Euro Holds the Line: EURUSD Finds Support at the 365-EMA as Peace Talks Loom
  FxWirePro: GBP/NZD down trend loses steam, remains on bearish path
  Ethereum Consolidates: Bullish Technicals Point to a Potential $3,000 Breakout
  FxWirePro: GBP/AUD gains some upside momentum but still bearish
  FxWirePro: USD/CAD extends decline on broad dollar weakness
  Energy Surge Ignites US Inflation: USDCHF Eyes Support Amid Dollar Sell-Off
  FxWirePro- Major European Indices


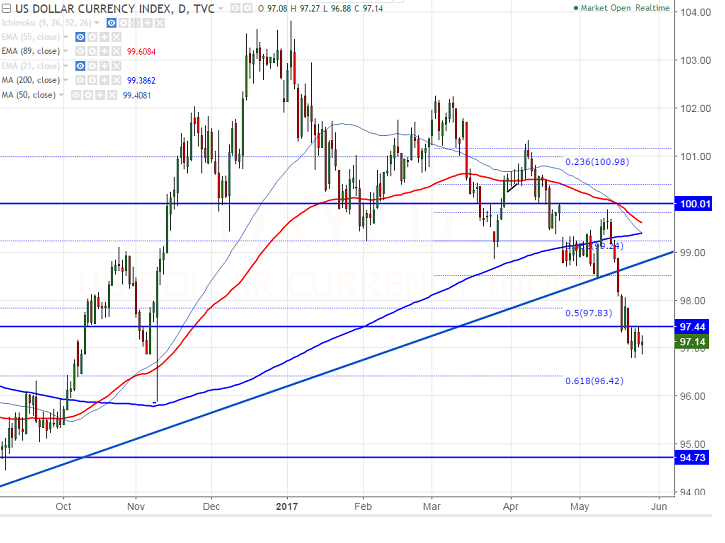
- US Dollar index shown minor weakness after jumping till 97.47. It is currently trading around 97.16.
- Short term trend is still weak as long as index not closing above 89 EMA in the weekly chart. The index has shown a huge decline from the high 103.82 and downside capped by 61.8% fibo at 96.40 and bearish continuation can be seen below that level.
- The near term resistance is around 97.45 (89 W EMA) and any close above will take the index till 98.60 (support turned into resistance)/ 99.25 (200 MA)/99.89.
- On the lower side, major near term support is around 96.40 (61.8% fibo) and any break below will drag the index till 95.91 (Nov 9th 2016 low)/95.
It is good to buy above 97.50 with SL around 97 for the TP of 98.60


