


 EUR/USD Bounces from Monthly Low, But Bearish Pressure Remains
  FxWirePro: USD/JPY eases ahead of Fed decision , Intervention risks linger
  JPY Pairs Action Bias: EURJPY Leads as Bullish Standout Amid Mixed Momentum
  FxWirePro: NZD/USD neutral in the near-term, scope for downward resumption
  FxWirePro- Woodies pivot (Major)
  FxWirePro: GBP/AUD gains some upside momentum but still bearish
  FxWirePro- Major Pair levels and bias summary
  FxWirePro- Major Crypto levels and bias summary
  Buy the Dips on EUR/JPY: Bullish Structure Points to 188 Target Ahead of Fed
  FxWirePro: USD/ZAR retreats but trend is still bullish
  FxWirePro: USD/CAD slips after Fed holds rates steady
  FxWirePro: AUD/USD falls after softer-than-expected Australian Q2 CPI
  FxWirePro: USD/ZAR firms ahead of Fed interest rate decision
  FxWirePro: EUR/ AUD gains some ground , but remains on bearish path
  FxWirePro: GBP/USD edges higher as traders await BoE guidance and UK fiscal clarity


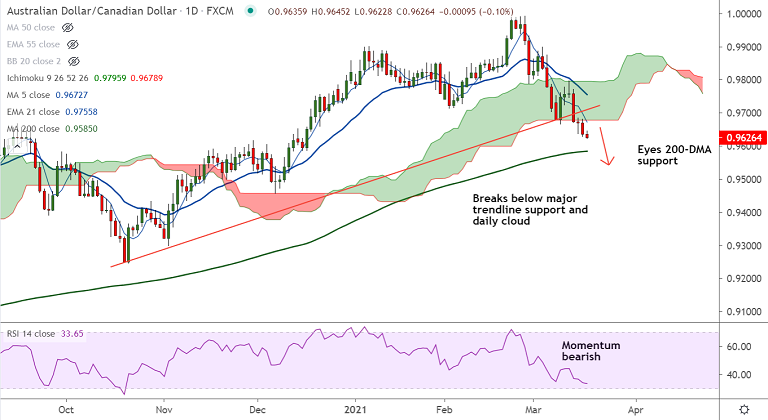
AUD/CAD chart - Trading View
Technical Analysis: Bias Bearish
- AUD/CAD is extending downside for the 4th straight session, outlook bearish
- Price action has slipped below daily cloud, adding to the downside bias
- GMMA indicator shows short term MAs have turned bearish and longer term MAs are constricted
- Recovery attempts have been capped at 200H MA
- Stochs and RSI are sharply lower and show strong bearish momentum
Support levels - 0.9585 (200-DMA), 0.9506 (55W EMA), 0.9428 (110W EMA)
Resistance levels - 0.9673 (5-DMA), 0.9689 (21W EMA), 0.9708 (200H MA)
Summary: AUD/CAD bearish bias rises with breach below cloud. Fears of employment backlash as the Australian government’s job relief package expires in March is likely to keep pressure on the Aussie. Further, fresh Sino-American tussles, US sanctions over Russia and Japan’s trade-punitive measures on the US beef are some extra hurdles to market sentiment which add to the bearish bias. AUD/CAD in on track to test 200-DMA support at 0.9585. Violation there will open downside for the pair.


