


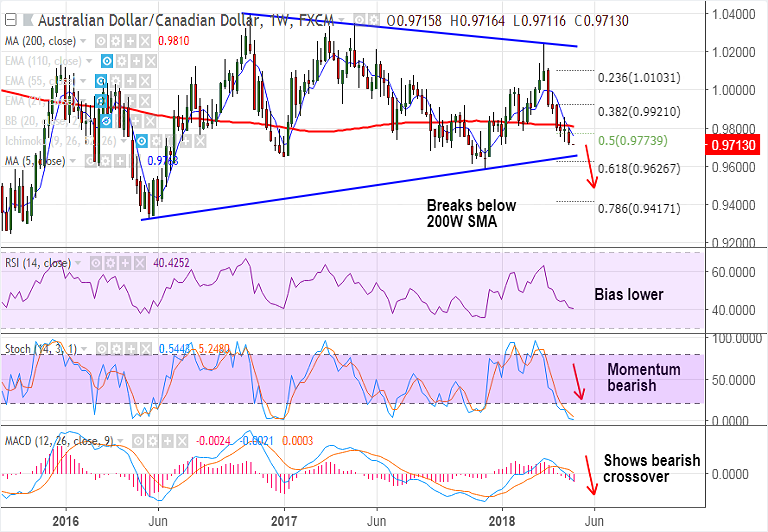
- AUD/CAD pauses downside after break below 200W SMA at 0.9810, bias bearish.
- The pair is trading in a Symmetric Triangle pattern and we see scope for test of Triangle base at 0.9645.
- Technical indicators on weekly charts are highly bearish. Violation at Triangle Base could see further weakness.
- RSI weakness below 50 and biased lower. Stochs are sharply lower and MACD shows bearish crossover on signal line.
- Next major support below Triangle base lies at 0.9627 (61.8% Fib) ahead of 0.9579 (Dec 2017 low).
- Immediate resistance is seen at 5-DMA at 0.9725. Bearish invalidation only on retrace above 200W SMA at 0.9810.
- Focus on RBA policy meet for further impetus.
Support levels - 0.9710 (Jan 2018 low), 0.97, 0.9645 (Triangle base), 0.9626 (61.8% Fib)
Resistance levels - 0.9725 (5-DMA), 0.9763 (5W SMA), 0.98
Recommendation: Good to go short on rallies around 0.9725, SL: 0.9765, TP: 0.9645/ 0.96/ 0.9580.
FxWirePro Currency Strength Index: FxWirePro's Hourly AUD Spot Index was at 1.70313 (Neutral), while Hourly CAD Spot Index was at 114.416 (Bullish) at 1100 GMT. For more details on FxWirePro's Currency Strength Index, visit http://www.fxwirepro.com/currencyindex.
FxWirePro launches Absolute Return Managed Program. For more details, visit http://www.fxwirepro.com/invest.


