


 Goldman Predicts 50% Odds of 10% U.S. Tariff on Copper by Q1 Close
  Energy Sector Outlook 2025: AI's Role and Market Dynamics
  Gold Prices Slide as Rate Cut Prospects Diminish; Copper Gains on China Stimulus Hopes
  Oil Prices Dip Slightly Amid Focus on Russian Sanctions and U.S. Inflation Data
  FxWirePro- Major Pair levels and bias summary
  FxWirePro: GBP/NZD gaining momentum for a move towards 2.3350level
  FxWirePro: GBP/USD slides toward critical support market reassesses UK political transition
  Trump’s "Shock and Awe" Agenda: Executive Orders from Day One
  Mexico's Undervalued Equity Market Offers Long-Term Investment Potential
  Moldova Criticizes Russia Amid Transdniestria Energy Crisis
  Global Markets React to Strong U.S. Jobs Data and Rising Yields
  Moody's Upgrades Argentina's Credit Rating Amid Economic Reforms
  Bank of America Posts Strong Q4 2024 Results, Shares Rise
  US Gas Market Poised for Supercycle: Bernstein Analysts
  BTC Slips Below $60K as Institutional Demand Dries Up — Bears Eye $59K Support, Rallies to $63K for Shorts
  U.S. Banks Report Strong Q4 Profits Amid Investment Banking Surge
  Urban studies: Doing research when every city is different


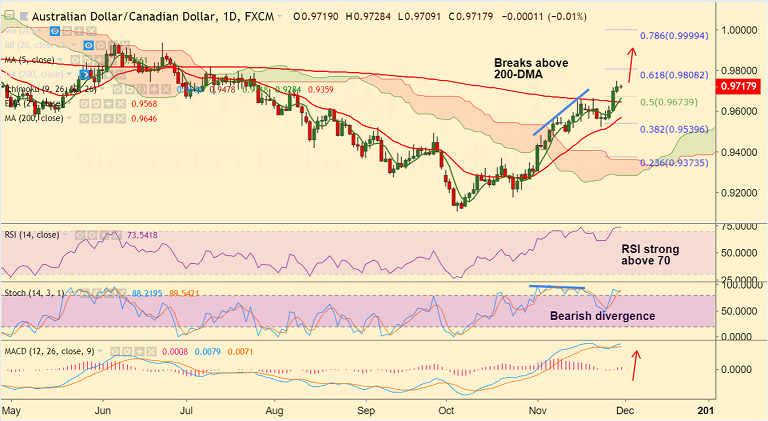
AUD/CAD chart on Trading View used for analysis
- AUD/CAD trades rangebound on the day, markets await Canada GDP data.
- Price action is pausing upside after 5 consecutive sessions of gains.
- Technical indicators support further gains. Stochs and RSI are biased higher, momentum bullish.
- The pair is in a near-term bull trend and breakout at 200-DMA has raised scope for further upside.
- That said, we evidence a bearish divergence on Stochs which dents scope for upside.
- Bias higher as long as 200-DMA support holds. Next major resistance lies at 61.8% Fib at 0.98.
- On the flipside, retrace below 200-DMA could see test of 21-EMA. Violation there to see bullish invalidation.
Support levels - 0.9661 (5-DMA), 0.9646 (200-DMA), 0.9568 (21-EMA)
Resistance levels - 0.9748 (Nov 28 high), 0.9808 (61.8% Fib), 1.00 (78.6% Fib)
For details on FxWirePro's Currency Strength Index, visit http://www.fxwirepro.com/currencyindex.


