


 FxWirePro: GBP/USD heads deeper into bear territory, 23.6% fibonacci eyed
  FxWirePro: NZD/USD downside pressure builds, key support level in focus
  U.S. Treasury Yields Expected to Decline Amid Cooling Economic Pressures
  FxWirePro: GBP/AUD steadies around 0.9145 ,retains bid tone
  NZDJPY Bears Reload as 92 Resistance Caps Bounce; Sell-on-Rallies Eyed Toward 90
  Urban studies: Doing research when every city is different
  Bitcoin Sheds $491M in ETF Outflows and Retreats Below $64K; Sellers Reload for $50K
  FxWirePro: GBP/NZD gaining momentum for a move towards 2.3350level
  AUDJPY Breaks Key Trendline Support — Bears Eye 110 as Momentum Accelerates
  Sterling Slump Sends GBPJPY Toward 212.60 — Bearish EMA Stack Eyes 210
  UBS Projects Mixed Market Outlook for 2025 Amid Trump Policy Uncertainty
  FxWirePro: GBP/USD slides toward critical support market reassesses UK political transition
  Gold Prices Slide as Rate Cut Prospects Diminish; Copper Gains on China Stimulus Hopes
  FxWirePro: USD/CNY hits one –month high, scope for further upside
  European Stocks Rally on Chinese Growth and Mining Merger Speculation
  EURJPY Bounce Loses Steam Below 184 — Sell-the-Rally Setup Eyes 183 Target
  FxWirePro- Major Pair levels and bias summary


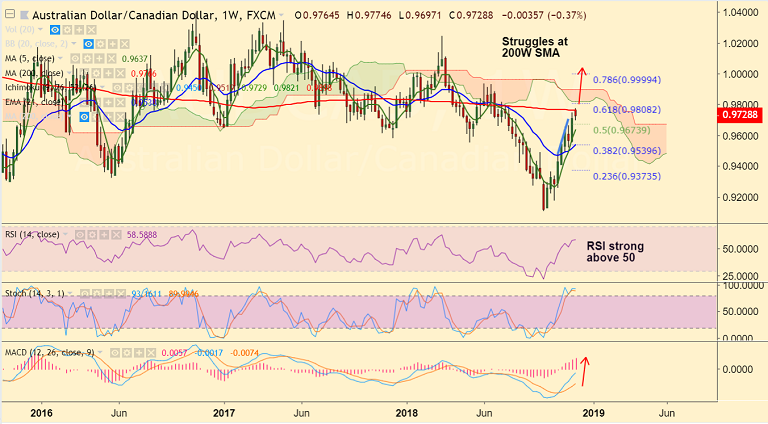
AUD/CAD chart on Trading View used for analysis
- AUD/CAD has failed to break above 200-W SMA which offers stiff resistance at 0.9766.
- The pair trades with strong bullish momentum and breakout at 200-W SMA could propel the pair higher.
- RSI strong on weekly charts, holds above 50 mark and bias higher. MACD is showing a bullish crossover on signal line and bias bullish.
- Breakout at 200W SMA eyes next major resistance at 61.8% Fib at 0.9808 ahead of weekly cloud top at 0.9898.
- On the flipside, rejection at 200-W SMA with break below 200-DMA could see weakness till 0.9523 (Nov 18 low)
Recommendation: Watch out for decisive break above 200W SMA to go long.
For details on FxWirePro's Currency Strength Index, visit http://www.fxwirepro.com/currencyindex.


