


 UBS Projects Mixed Market Outlook for 2025 Amid Trump Policy Uncertainty
  Indonesia Surprises Markets with Interest Rate Cut Amid Currency Pressure
  Goldman Predicts 50% Odds of 10% U.S. Tariff on Copper by Q1 Close
  U.S. Treasury Yields Expected to Decline Amid Cooling Economic Pressures
  AUDJPY Breaks Key Trendline Support — Bears Eye 110 as Momentum Accelerates
  Global Markets React to Strong U.S. Jobs Data and Rising Yields
  Sterling Slump Sends GBPJPY Toward 212.60 — Bearish EMA Stack Eyes 210
  FxWirePro: USD/CNY hits one –month high, scope for further upside
  NZDJPY: The Kiwi Yen's Bull Run Hits a Brick Wall at 92 — Sell the Rally?
  FxWirePro: AUD/USD drifts lower, uninspired by jobs beat
  Moody's Upgrades Argentina's Credit Rating Amid Economic Reforms
  European Stocks Rally on Chinese Growth and Mining Merger Speculation
  U.S. Banks Report Strong Q4 Profits Amid Investment Banking Surge
  AUDJPY Bears Take a Breather at 111.50, But ‘Sell on Rallies’ Still Eyes 110
  Gold Prices Slide as Rate Cut Prospects Diminish; Copper Gains on China Stimulus Hopes
  Oil Prices Dip Slightly Amid Focus on Russian Sanctions and U.S. Inflation Data
  ETH Bounces as Shorts Cover, Yet ETF Bleed Warns $1,850 Resistance Won’t Break


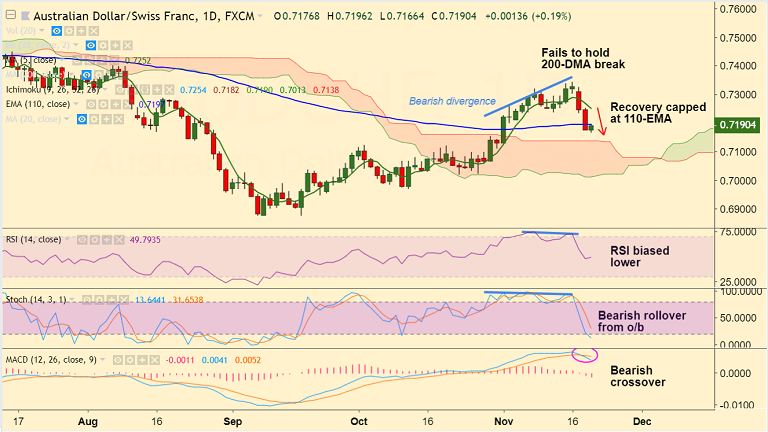
AUD/CHF chart on Trading View used for analysis
- AUD/CHF has resumed downside after brief pause on Wednesday's trade.
- Price is extending weakness after failure to hold break above 200-DMA, slips lower with a spinning top formation.
- Technical indicators on daily charts are bearish. Stochs and RSI have rolled are biased lower.
- We see bearish divergence on RSI and Stochs which adds to the bearish bias.
- 5-DMA is sharply lower and MACD is showing a bearish crossover on signal line.
- The pair is currently holding strong support at 110-EMA, break below to see major weakness.
- Next major support below 110-EMA lies at 21-EMA at 0.7212 ahead of 0.7136 (converged trendline and cloud top)
Support levels - 0.7198 (110-EMA), 0.7212 (21-EMA), 0.7136 (cloud top and trendline), 0.71
Resistance levels - 0.7213 (5-DMA), 0.7292 (200-DMA), 0.73
For details on FxWirePro's Currency Strength Index, visit http://www.fxwirepro.com/currencyindex.


