
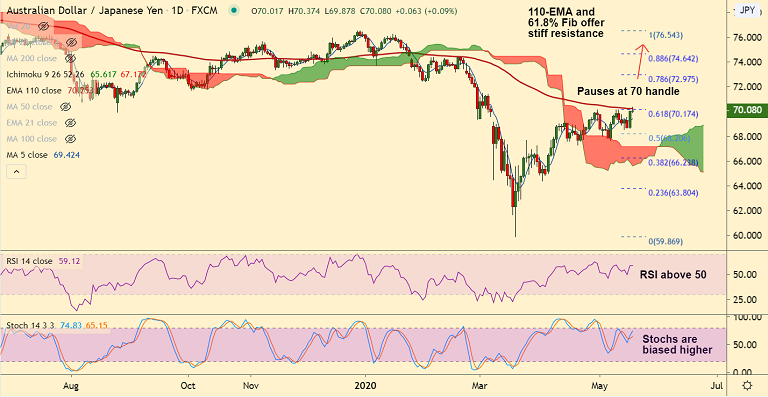
AUD/JPY chart - Trading View
Technical Analysis: Bias Bullish
GMMA Indicator:
- Major Trend: Neutral
- Minor Trend: Bullish
Ichimoku Analysis:
- The pair is trading above daily cloud
- Minor pullbacks have bounced off Kijun Sen
Oscillators:
- RSI is above 50 and biased higher
- Stochs are biased higher, momentum bullish
Bollinger Bands:
- Bollinger Bands are flat on the daily charts, volatility is high
High/Low:
- Previous Week High/Low - 70.17/ 68.54
- Previous Session High/Low - 70.05/ 68.64
Major Support Levels: 69.43 (5-DMA), 69.04 (55-EMA), 68.20 (50% Fib)
Major Resistance Levels: 70.25 (110-EMA), 72.11 (200-DMA), 72.60 (74.6% Fib)
Summary: AUD/JPY has broken above major trendline resistance technical indicators are favourable for further gains. The pair has paused upside at 70 mark. 110-EMA and 61.8% Fib offers stiff resistance. Break above will fuel further gains. Little resistance thereafter till 200-DMA at 72.11.


