


 Major Pairs Action Bias: USDCAD and USDCHF Stand Out as Extremely Bullish While GBPUSD and NZDUSD Turn Extremely Bearish
  FxWirePro: GBP/NZD maintains bersish bias with focus on 2.2900 level
  FxWirePro: USD/ZAR uptrend loses steam, remains on bullish path
  FxWirePro: USD/CAD gaining momentum for a move towards 1.4200 level
  FxWirePro- Woodies pivot (Major)
  EUR/JPY Holds Bullish Bias as Euro Extends Recovery
  FxWirePro: EUR/ AUD gains some ground , but remains on bearish path
  FxWirePro: AUD/USD dips after RBA Governor speech
  FxWirePro- Major Pair levels and bias summary
  FxWirePro: USD/ZAR retreats but trend is still bullish
  EUR/USD Bounces from Monthly Low, But Bearish Pressure Remains
  FxWirePro- Major Pair levels and bias summary
  JPY Action Bias: USDJPY Emerges as the Clear Bullish Pair to Watch Amid Mixed Crosses
  FxWirePro: NZD/USD edges lower, remains on back foot
  FxWirePro- Woodies pivot (Major)


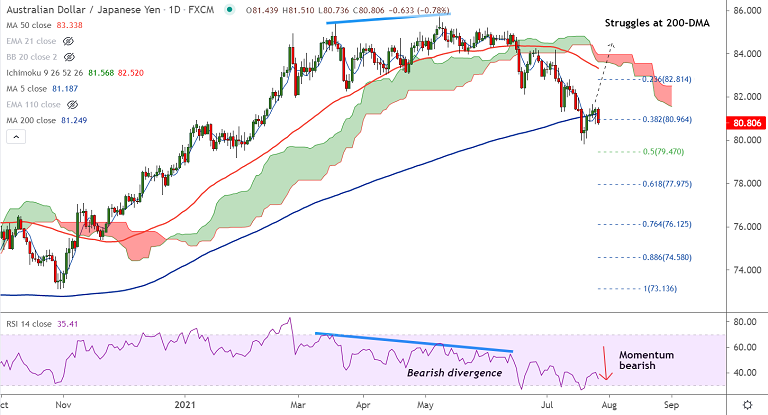
AUD/JPY chart - Trading View
Spot Analysis:
AUD/JPY was trading 0.58% lower on the day at 80.96 at around 08:15 GMT
Previous Week's High/ Low: 81.65/ 79.83
Previous Session's High/ Low: 81.51/ 80.77
Fundamental Overview:
Markets remain risk-off amid negative coronavirus headlines from Australia. The new Delta variant cases continue to rise causing concerns about potential lockdowns.
On the data front, China’s Industrial Profits for June eased from 36.4% to 20.00% YoY, exerting additional downside pressure on the AUD.
Risk-off and poor China data weigh on the pair, dragging it lower.
Technical Analysis:
- Price action has broken below 200-DMA support
- GMMA indicator shows major and minor trend are bearish
- Momentum is with the bears, Stochs and RSI are biased lower
- Volatility is high and rising as evidenced by widening Bollinger bands
Major Support and Resistance Levels:
Support - 80.38 (55-week EMA), Resistance - 81.24 (200-DMA)
Summary: Recovery attempts failed to extend break above 200-DMA. Price action is below cloud and major moving averages. The pair eyes next major support at 80.38, break below will see dip till 50% Fib at 79.47.


