


 FxWirePro: AUD/USD dips below lower range, bearish bias increases
  U.S. Stocks vs. Bonds: Are Diverging Valuations Signaling a Shift?
  Moody's Upgrades Argentina's Credit Rating Amid Economic Reforms
  UBS Projects Mixed Market Outlook for 2025 Amid Trump Policy Uncertainty
  FxWirePro: NZD/USD firms as Kiwi gains on strong ANZ business outlook data
  U.S. Banks Report Strong Q4 Profits Amid Investment Banking Surge
  AUD/JPY Slips Below 112 as BOJ Intervention Sparks Bearish Momentum: Sell the Rallies
  European Stocks Rally on Chinese Growth and Mining Merger Speculation
  FxWirePro: GBP/USD rises as soft US data pressures dollar
  FxWirePro: GBP/AUD gains above 1.9200 level , upside pressure builds
  S&P 500 Relies on Tech for Growth in Q4 2024, Says Barclays
  US Futures Rise as Investors Eye Earnings, Inflation Data, and Wildfire Impacts
  FxWirePro:USD/JPY climbs back above 160.00 after BOJ rate decision
  Trump’s "Shock and Awe" Agenda: Executive Orders from Day One
  FxWirePro- Major Crypto levels and bias summary
  Mexico's Undervalued Equity Market Offers Long-Term Investment Potential


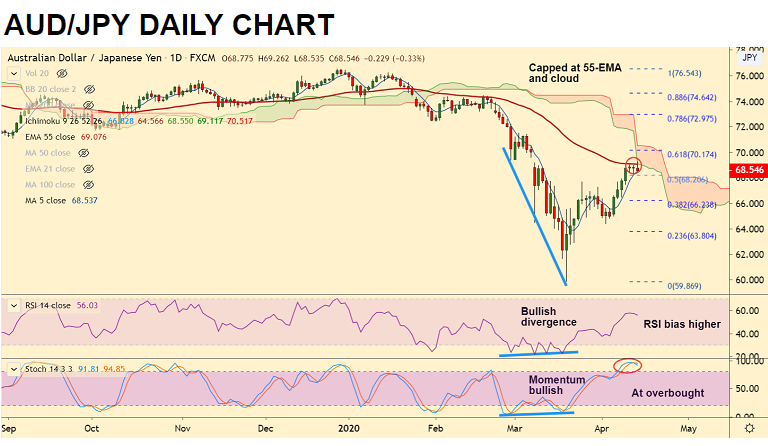
AUD/JPY chart - Trading View
AUD/JPY was trading 0.28% lower at 68.58 at around 10:35 GMT after closing largely muted in the previous session.
Back to back 'Doji' formations on the daily candles in the previous sessions suggests upside exhaustion.
The pair is finding stiff resistance at 55-EMA and daily cloud, any further upside only on break above.
GMMA indicator shows major trend in the pair is neutral and minor trend is slowly fading upside.
RSI is turning and Stochastics are at overbought levels which raise scope for reversal.
5-DMA is immediate support at 68.54. Break below will see further weakness. Next major support aligns at 21-EMA at 67.33 ahead of 20-DMA at 66.22.
On the flipside, breakout at 55-EMA resistance (69.07) to see next resistance at 61.8% Fib at 70.17 and then 200-DMA at 72.82.
Focus on Australia Westpac Consumer Confidence and Employment data due later in the week for further impetus.


