


 FxWirePro: USD/CAD runs out of steam but maintains bullish outlook
  EUR/JPY Holds Bullish Bias as Euro Extends Recovery
  JPY Action Bias: USDJPY Emerges as the Clear Bullish Pair to Watch Amid Mixed Crosses
  FxWirePro: EUR/AUD outlook weaker on renewed downside pressure
  FxWirePro: USD/ZAR uptrend loses steam, remains on bullish path
  FxWirePro: NZD/USD edges lower, remains on back foot
  FxWirePro: EUR/NZD up trend gains momentum but hurdles ahead
  FxWirePro: GBP/USD edges higher as traders await BoE guidance and UK fiscal clarity
  FxWirePro: AUD/USD dips after RBA Governor speech
  Major Pairs Action Bias: USDCAD and USDCHF Stand Out as Extremely Bullish While GBPUSD and NZDUSD Turn Extremely Bearish
  FxWirePro: GBP/AUD downside pressure builds, key support level in focus
  FxWirePro: GBP/NZD maintains bersish bias with focus on 2.2900 level
  FxWirePro: USD/CAD gaining momentum for a move towards 1.4200 level
  FxWirePro : USD/JPY holds relatively bid on 163 ahead Of FOMC,BoJ meetings
  FxWirePro: USD/JPY eases ahead of Fed decision , Intervention risks linger
  NZDJPY Pullback: Sell Rallies Toward 93.30 as Yen Weakness Eases


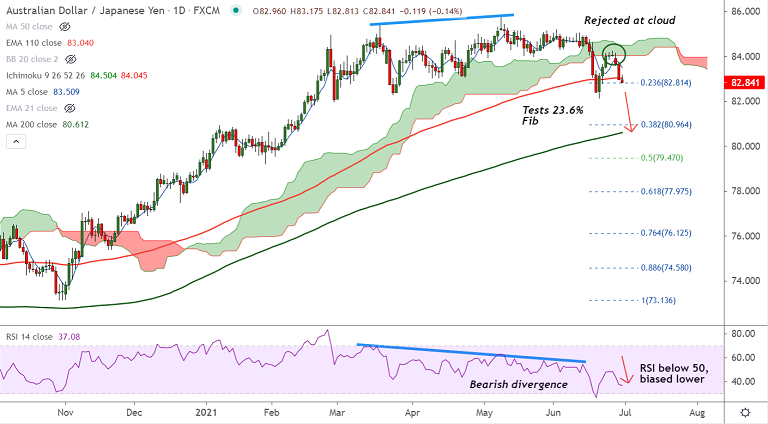
AUD/JPY chart - Trading View
Spot Analysis:
AUD/JPY was trading 0.15% lower on the day at 82.84 at around 08:55 GMT
Previous Week's High/ Low: 84.25/ 82.13
Previous Session's High/ Low: 83.72/ 82.96
Fundamental Overview:
Mixed official Chinese PMIs fail to impress the antipodeans. China’s NBS Manufacturing and Non-Manufacturing PMIs cross market consensus but stayed below priors.
China’s NBS Manufacturing PMI rose past 50.8 forecast to 50.9 but lagged behind the 51.00 prior.
Further, Non-Manufacturing PMI also stayed below 55.2 prior despite crossing 52.7 market consensus with 53.5 readings for June.
According to latest Reuters poll, the Reserve Bank of Australia (RBA) is likely to maintain the Official Cash Rate (OCR) at a record low of 0.1% for the seventh straight meeting next Tuesday.
Japan’s Industrial Production grew past market consensus and prior to 22.0% YoY in May.
Renewed Covid fears are weighing on the risky assets and sending a bid into the safe-haven assets.
Technical Analysis:
- AUD/JPY is extending weakness for the 3rd straight session
- Price action has broken below 110-EMA and is testing 23.6% Fib
- Volatility is rising as evidenced by widening Bollinger bands
- Bearish momentum and rising volatility to drive further weakness
Major Support and Resistance Levels:
Support - 82.81 (23.6% Fib), 82 (Psychological mark), 81.65 (110-month EMA)
Resistance - 83.04 (110-EMA), 83.50 (5-DMA), 84.74 (200-month MA)
Summary: AUD/JPY trades with a bearish bias. Price action was rejected at daily cloud and is on track for further downside. Bearish invalidation above daily cloud.


