


 Major Pairs Action Bias: USDCAD and USDCHF Stand Out as Extremely Bullish While GBPUSD and NZDUSD Turn Extremely Bearish
  AUDJPY Weakness Deepens: Sell Rallies Toward 112 as Aussie Dollar Falters
  FxWirePro : USD/JPY holds relatively bid on 163 ahead Of FOMC,BoJ meetings
  FxWirePro- Major Pair levels and bias summary
  GBPJPY Slips After Sterling Weakness, Bears Eye 216
  NZDJPY Pullback: Sell Rallies Toward 93.30 as Yen Weakness Eases
  EUR/USD Bounces from Monthly Low, But Bearish Pressure Remains
  NZDJPY Action Bias: Bullish Dip-Buying Opportunity on Broad Yen Weakness
  FxWirePro- Major Pair levels and bias summary
  FxWirePro: USD/ZAR uptrend loses steam, remains on bullish path
  FxWirePro: USD/ZAR retreats but trend is still bullish
  FxWirePro: EUR/AUD outlook weaker on renewed downside pressure
  JPY Action Bias: USDJPY Emerges as the Clear Bullish Pair to Watch Amid Mixed Crosses
  FxWirePro- Woodies pivot (Major)
  FxWirePro: EUR/NZD up trend gains momentum but hurdles ahead
  Crypto Action Bias: ETHUSD Stands Out as the Bullish Pair to Watch


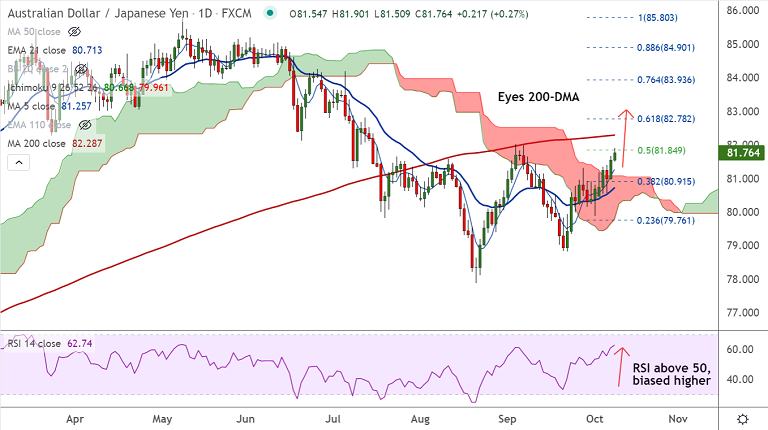
AUD/JPY chart - Trading View
Technical Analysis: Bias Bullish
- AUD/JPY trades 0.24% higher on the day at 81.75 at around 13:10 GMT
- The pair is extending break out of daily cloud, Chikou span is biased higher
- Momentum is strongly bullish, Stochs and RSI are biased higher
- MACD is above the zero level and supports upside, ADX is also in favour of bulls
- Volatility is high and rising as evidenced by widening Bollinger bands
- GMMA indicator shows major trend is neutral, but minor trend is bullish
Support levels - 81.33 (110-EMA), 81.25 (5-DMA), 80.87 (55-EMA)
Resistance levels - 81.84 (50% Fib), 82.28 (200-DMA), 82.78 (61.8% Fib)
Summary: AUD/JPY trades with a bullish bias. Scope for test of 200-DMA at 82.28. Break above 200-DMA will take the pair higher to 61.8% Fib at 82.78.


