


 FxWirePro: GBP/USD edges lower ahead of Fed policy verdict
  FxWirePro: GBP/AUD gains some upside momentum but still bearish
  FxWirePro: GBP/AUD gains above 1.9200 level , upside pressure builds
  FxWirePro: EUR/ AUD gains some ground , but remains on bearish path
  Buy the Dips on EUR/JPY: Bullish Structure Points to 188 Target Ahead of Fed
  FxWirePro: AUD/USD dips below lower range, bearish bias increases
  FxWirePro: NZD/USD neutral in the near-term, scope for downward resumption
  Major Forex Pairs Action Bias: GBPUSD and AUDUSD Turn Extremely Bearish
  FxWirePro: USD/JPY eases ahead of Fed decision , Intervention risks linger
  FxWirePro- Major Pair levels and bias summary
  NZDJPY Bullish Rebound: Buy Dips as EMAs Align for 97 Target
  FxWirePro: EUR/AUD regains upwards momentum but unable to hold above 50%fib level
  FxWirePro: NZD/USD firms as Kiwi gains on strong ANZ business outlook data
  FxWirePro: GBP/NZD maintains bersish bias with focus on 2.2900 level
  NZD/JPY Flatlines Near 94.60: Will Key Support Reignite the Uptrend?
  FxWirePro : GBP/NZD strongly bearish despite upside attempts


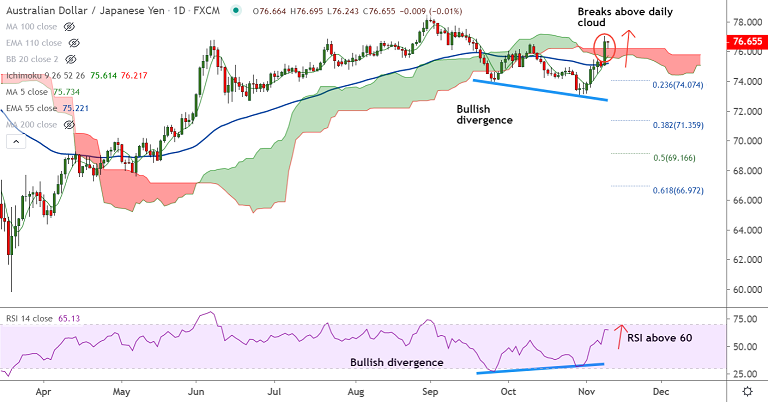
AUD/JPY chart - Trading View
Technical Analysis: Bias Bullish
- Closes above cloud on Monday's trade and pullbacks on the dat finds strong support at cloud
- Oscillators are bullish and RSI is above 60 mark, shows strength in the current uptrend.
- GMMA shows minor trend is strongly bullish, while major trend remains neutral
- Bullish RSI divergence on the daily charts raises scope for upside.
- Price action is above major moving averages and volatility is rising which could fuel further gains
Support levels - 76.21 (Cloud top), 75.73 (5-DMA), 75.22 (55-EMA),
Resistance levels - 77.80 (Upper W BB), 78.67 (61.8% Fib), 79.42 (200W MA)
Data Watch: China inflation data came in below forecasts which raises doubts on the nation's economic recovery. China Producer Price Inflation or factory-gate prices fell by 2.1% year-on-year in October versus an expected drop of 2%. The Consumer Price Index declined by 0.3% month-no-month, missing the expectation for a 0.2% rise and bringing the annualized growth to 0.5% from September's 0.8%.
Summary: AUD/JPY is extending gains for the second straight week after pullback has bounced off 50W MA support. Risk-on environment on the back of breakthrough in the coronavirus vaccine keep the pair supported. Technical analysis also points to further gains. Scope for test of 200W MA at 79.42. Failure to hold above cloud will negate bullish bias.


