
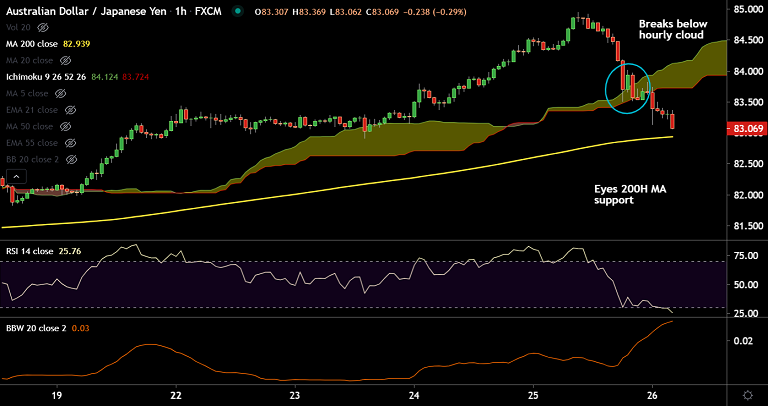
AUD/JPY chart - Trading View
Technical Analysis: Bias Turning Bearish
- AUD/JPY grinds lower for the 2nd straight session
- Price action slips below 5-DMA and hourly cloud
- GMMA shows bearish shift on the intraday charts
- Potential 'Inverted Hammer' on weekly charts keeps bias lower
- Stochs and RSI are on verge of bearish rollover from overbought levels
Support levels - 82.94 (200H MA), 82.00 (21-EMA), 81.73 (20-DMA)
Resistance levels - 83.47 (5-DMA), 84.32 (Upper BB), 84.64 (200 month MA)
Summary: Rising risk-off and poor data keep the pair depressed. The bonds in Australia hit multi-month top earlier in the day, triggering the RBA to buy 3-year government bonds worth three billion Australian dollars to tame the Treasury yields. On the data front, Australia’s Private Sector Credit for January eased below 0.3% to 0.2% MoM. The YoY reading also fell to 1.7% from 1.8% prior. Break below 200H MA will see more downside. Dip till 21-EMA at 81.99 likely.


