


 FxWirePro: GBP/NZD downside pressure builds, key support levels in focus
  FxWirePro: USD/CAD positions for another climb, eyes 1.4150 level
  FxWirePro: GBP/AUD under pressure as pound continues to weaken
  FxWirePro: USD/CNY edges higher but bulls lack punch
  JPY Action Bias: USDJPY, EURJPY, and CADJPY Emerge as Top Extremely Bullish Picks
  EUR/USD Slides After ECB Hold, Bearish Technicals Favor Rally Fades
  FxWirePro: GBP/USD slips as middle east tensions and oil surge pressure pound
  FxWirePro: USD/ZAR surges as rand slumps after SARB rate hold surprise
  Major Pairs Action Bias: USDCHF Emerges Extremely Bullish as EURUSD and GBPUSD Turn Deeply Bearish
  FxWirePro: GBP/USD downtrend loses steam but outlook still bearish
  FxWirePro: GBP/NZD gains some ground but outlook is bearish
  FxWirePro- Major Crypto levels and bias summary
  BTC, ETH, SOL, XRP, and BNB: Major Crypto Pairs Stay Neutral
  FxWirePro: EUR/NZD downside pressure builds, key support level in focus
  FxWirePro: USD/CAD edges lower but bullish outlook persists
  FxWirePro- Major Crypto levels and bias summary


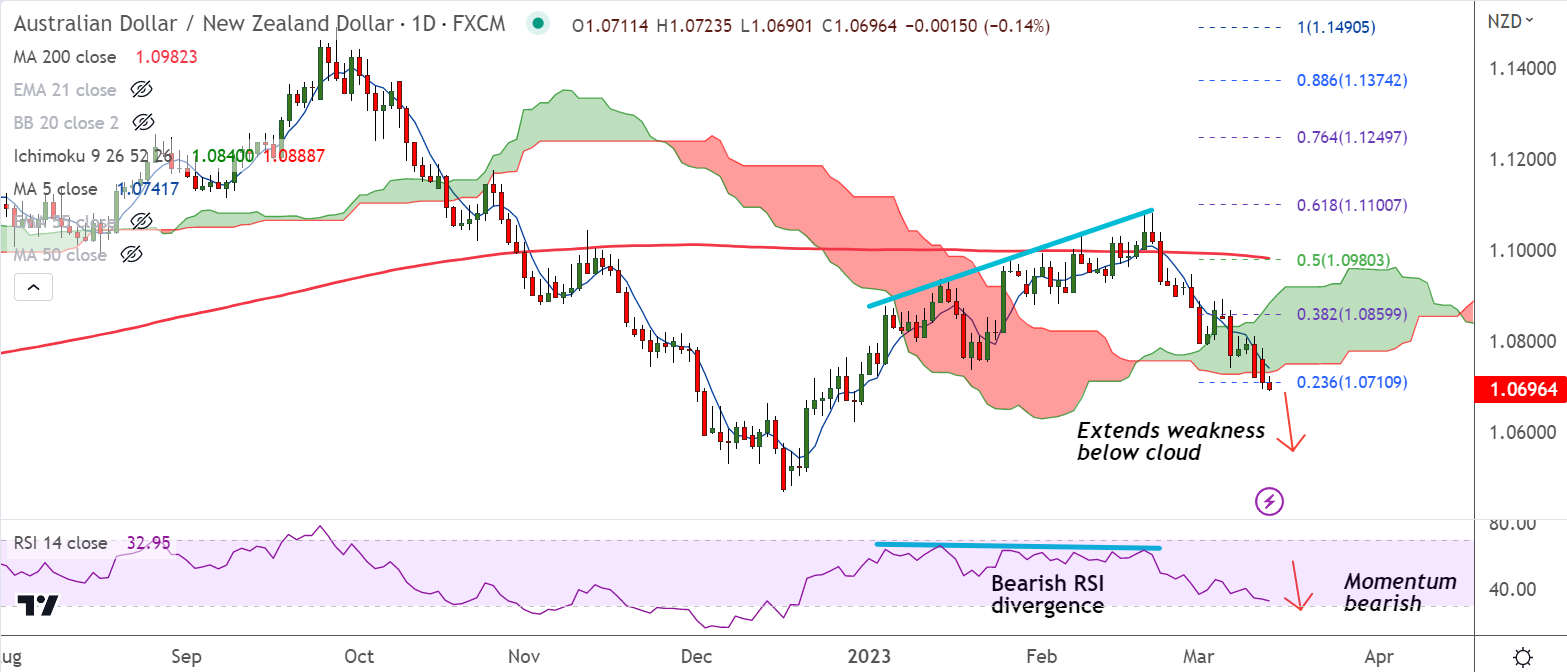
Chart - Courtesy Trading View
Technical Analysis:
- AUD/NZD was trading 0.15% lower on the day at 1.0695 at around 10:35 GMT
- The pair is extending break below daily cloud, more weakness on cards
- GMMA indicator shows major and minor trend are bearish, price action below major moving averages
- Momentum is bearish, Stochs and RSI are sharply lower, volatility is high and rising
- MACD and ADX support downside in the pair, Chikou span is biased lower
Support levels:
S1: 1.0661 (Lower BB)
S2: 1.0622 (29th Dec 2022 low)
Resistance levels:
R1: 1.0741 (5-DMA)
R2: 1.0796 (200H MA)
Summary: AUD/NZD trades with a bearish bias. Price action hovers around 200-week SMA which is strong support at 1.07. Decisive break below 200-week SMA will confirm further downside.


