


 UBS Predicts Potential Fed Rate Cut Amid Strong US Economic Data
  U.S. Stocks vs. Bonds: Are Diverging Valuations Signaling a Shift?
  Oil Prices Dip Slightly Amid Focus on Russian Sanctions and U.S. Inflation Data
  Fed May Resume Rate Hikes: BofA Analysts Outline Key Scenarios
  FxWirePro: USD/CNY hits one –month high, scope for further upside
  BTC Slips Below $60K as Institutional Demand Dries Up — Bears Eye $59K Support, Rallies to $63K for Shorts
  Bitcoin Sheds $491M in ETF Outflows and Retreats Below $64K; Sellers Reload for $50K
  FxWirePro- Major Crypto levels and bias summary
  Gold Prices Fall Amid Rate Jitters; Copper Steady as China Stimulus Eyed
  FxWirePro: USD/CAD hits 14-month high , Scope for further upside
  Global Markets React to Strong U.S. Jobs Data and Rising Yields
  ETH Bounces as Shorts Cover, Yet ETF Bleed Warns $1,850 Resistance Won’t Break
  FxWirePro: GBP/USD heads deeper into bear territory, 23.6% fibonacci eyed
  European Stocks Rally on Chinese Growth and Mining Merger Speculation
  FxWirePro:NZD/USD rout continues without relief
  2025 Market Outlook: Key January Events to Watch
  S&P 500 Relies on Tech for Growth in Q4 2024, Says Barclays


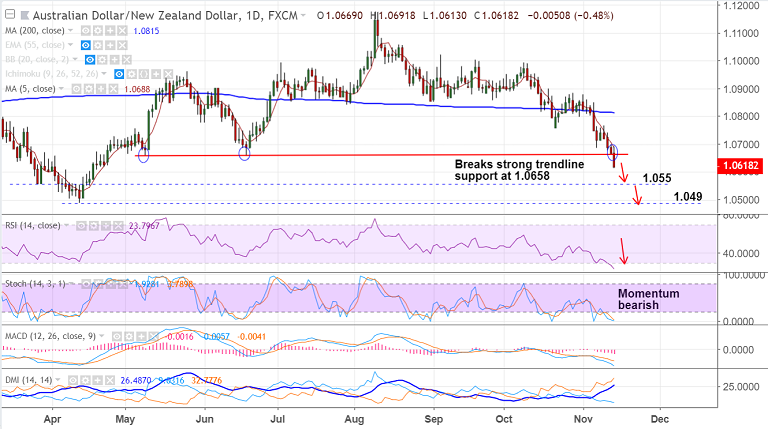
AUD/NZD chart on Trading View used for analysis
- AUD/NZD slumps lower on the day, is trading at 1.0617, down 0.48% at the time of writing.
- The pair has broken major trendline support at 1.0658 and we see scope for further weakness.
- Momentum studies are highly bearish on the daily and weekly charts. We see some oversold pressures on the dailies which could see some pullbacks.
- For now we do not see any major signs of reversal. Volatility is on the rise on weekly charts, momentum with the bears.
- We see strong support at 1.0585 (Triangle base). Breach there will accentuate weakness. Next bear targets below 1.0585 are 1.0550 and then 1.0490.
- Breakout above 200-DMA will invalidate our bearish bias.
Support levels - 1.0585 (Triangle base), 1.0550 (trendline), 1.0488 (Apr 12 low)
Resistance levels - 1.0658 (trendline), 1.0685 (5-DMA), 1.0774 (21-EMA)
Recommendation: Stay short on break below 1.0585, target 1.055/ 1.0485
For details on FxWirePro's Currency Strength Index, visit http://www.fxwirepro.com/currencyindex.


