


 FxWirePro- Woodies pivot (Major)
  FxWirePro- Woodies pivot (Major)
  FxWirePro: USD/ZAR retreats but trend is still bullish
  EUR/USD Bounces from Monthly Low, But Bearish Pressure Remains
  FxWirePro- Major Pair levels and bias summary
  EUR/JPY Holds Bullish Bias as Euro Extends Recovery
  FxWirePro: USD/ZAR firms ahead of Fed interest rate decision
  FxWirePro: GBP/NZD maintains bersish bias with focus on 2.2900 level
  EURUSD Spikes to 1.14306 on Fed Pause as Traders Eye Sell-the-Rally Setup
  FxWirePro: GBP/AUD gains some upside momentum but still bearish
  FxWirePro: AUD/USD falls after softer-than-expected Australian Q2 CPI
  Crypto Action Bias: ETHUSD Stands Out as the Bullish Pair to Watch
  FxWirePro: USD/CAD slips after Fed holds rates steady
  Buy the Dips on EUR/JPY: Bullish Structure Points to 188 Target Ahead of Fed
  FxWirePro: USD/CAD runs out of steam but maintains bullish outlook


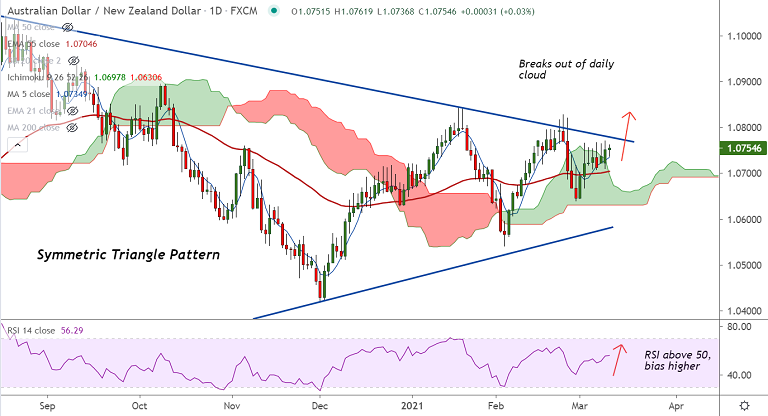
AUD/NZD chart - Trading View
Technical Analysis: Bias turning Bullish
- AUD/NZD was trading 0.05% higher at 1.0757 at around 10:20 GMT
- The pair has held support at 5-DMA, erased early losses and edged higher from session lows at 1.0736
- Price action has edged above daily cloud raising scope for further upside
- Stochs and RSI are biased higher and RSI is above 50 mark, supporting the current uptrend
- The pair has edged above monthly cloud and is on track to test 110 month EMA at 1.0962
Support levels - 1.0735 (5-DMA), 1.0719 (200-DMA), 1.0704 (55-EMA)
Resistance levels - 1.0780 (Triangle top), 1.0827 (Feb 23 high), 1.0962 (110 month EMA)
Summary: AUD/NZD is set to resume upside after the pair has shown a break out of daily cloud. Next immediate hurdle lies at Triangle top at 1.0780. Break above targets 110 month EMA at 1.0962.


