


 FxWirePro: USD/JPY eases ahead of Fed decision , Intervention risks linger
  FxWirePro: NZD/USD neutral in the near-term, scope for downward resumption
  FxWirePro- Major Crypto levels and bias summary
  FxWirePro: GBP/NZD maintains bersish bias with focus on 2.2900 level
  Buy the Dips on EUR/JPY: Bullish Structure Points to 188 Target Ahead of Fed
  EURUSD Spikes to 1.14306 on Fed Pause as Traders Eye Sell-the-Rally Setup
  FxWirePro: GBP/USD edges lower ahead of Fed policy verdict
  FxWirePro- Woodies pivot (Major)
  EUR/USD Bounces from Monthly Low, But Bearish Pressure Remains
  FxWirePro: USD/ CNY remains soft ahead of Fed decision
  FxWirePro: EUR/ AUD gains some ground , but remains on bearish path
  FxWirePro: GBP/USD edges higher as traders await BoE guidance and UK fiscal clarity
  FxWirePro: USD/ZAR firms ahead of Fed interest rate decision
  FxWirePro- Major Pair levels and bias summary
  FxWirePro- Woodies pivot (Major)
  Crypto Action Bias: ETHUSD Stands Out as the Bullish Pair to Watch


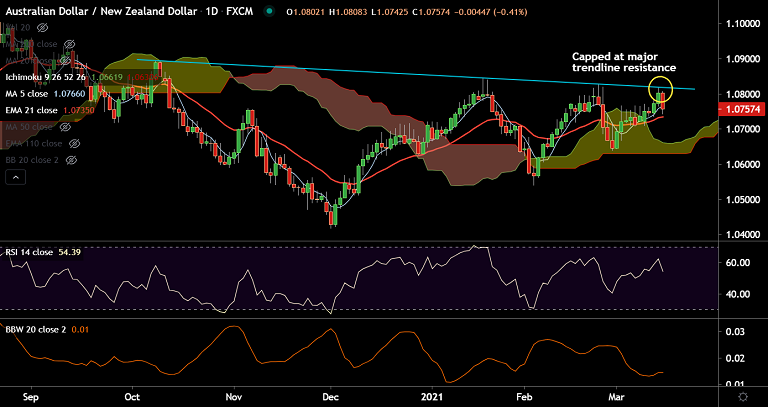
AUD/NZD chart - Trading View
Technical Analysis: Bias Turning Bearish
- AUD/NZD was trading 0.47% lower on the day at 1.0751 at around 12:45 GMT
- The pair was capped at major trendline resistance at 1.0820
- A potential 'Bearish Engulfing' candlestick pattern on daily charts raises scope for downside
- Price action hovers around 200H MA support at 1.0754, decisive break below will drag prices lower
- Major trend in the pair is neutral. Breach below 200-DMA support will change near-term bias to bearish
Support levels - 1.0734 (21-EMA), 1.0719 (200-DMA), 1.07 (110-EMA)
Resistance levels - 1.0820 (Trendline), 1.09, 1.0962 (110-month EMA)
Summary: Antipodeans fail to benefit from upbeat China data dump. Risk-off likely keeps the pair depressed. Technical bias is neutral with scope for bearish reversal. Watch out for break below 200-DMA for further weakness.


