


 FxWirePro : GBP/NZD strongly bearish despite upside attempts
  FxWirePro:EUR/NZD gains some upside momentum but still bearish
  FxWirePro: AUD/USD falls after softer-than-expected Australian Q2 CPI
  FxWirePro- Major Pair levels and bias summary
  FxWirePro: EUR/ AUD gains some ground , but remains on bearish path
  Major Forex Pairs Action Bias: GBPUSD and AUDUSD Turn Extremely Bearish
  FxWirePro: GBP/AUD gains above 1.9200 level , upside pressure builds
  FxWirePro- Major Crypto levels and bias summary
  Buy the Dips on EUR/JPY: Bullish Structure Points to 188 Target Ahead of Fed
  NZD/JPY Flatlines Near 94.60: Will Key Support Reignite the Uptrend?
  FxWirePro: USD/ CNY remains soft ahead of Fed decision
  EUR/JPY Holds Bullish Bias as Euro Extends Recovery
  FxWirePro: GBP/NZD maintains bersish bias with focus on 2.2900 level
  FxWirePro: USD/JPY eases ahead of Fed decision , Intervention risks linger
  FxWirePro- Woodies pivot (Major)


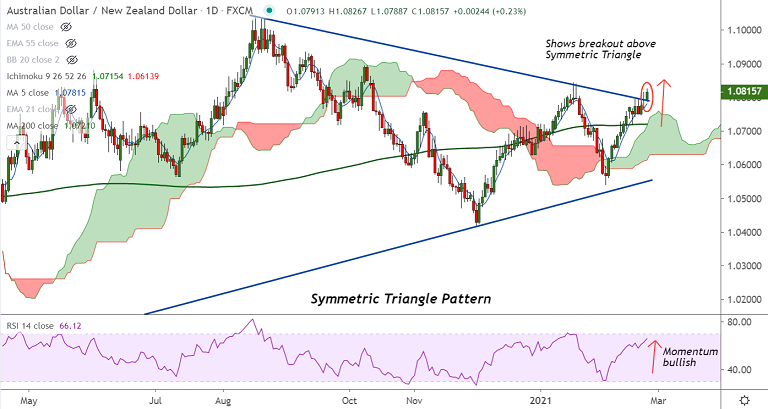
AUD/NZD chart - Trading View
AUD/NZD was trading 0.22% higher on the day at 1.0815 at around 03:30 GMT, outlook bullish.
The pair has confirmed breakout above Symmetric Triangle pattern boosting scope for further gains.
Retrace in price has bounced of 200-DMA support and price has edged above 55 month EMA. MACD and ADX support gains.
Momentum studies are bullish, Stochs and RSI are sharply higher, RSI is above the 60 mark, supporting the current uptrend.
Volatility is high and rising as evidenced by widening Bollinger bands. The pair has ignored Doji on Monday's candle and is extending gains.
AUD ignores Australia’s exports slump and remains bid amid rising commodity prices. Australia’s January month trade figures flashed downbeat data with exports dropping 9% and imports down 10%.
Earlier in the day ANZ-Roy Morgan Consumer Confidence data printed a third consecutive week of downbeat figures from 109.9 to 109.2 recently.
Support levels - 1.0795 (Trendline), 1.0781 (5-DMA), 1.0721 (200-DMA)
Resistance levels - 1.0839 (Upper BB), 1.0880 (June 2020 high), 1.0895 (Oct 2020 high)
Summary: AUD/NZD has confirmed a Symmetric Triangle breakout. Scope for test of 1.0880 ahead of 1.0895. Failure to close above Symmetric Triangle top will negate bullish bias.


