


 FxWirePro: AUD/USD gains on Iran-US truce hopes, risk rally
  FxWirePro: USD/ZAR uptrend loses steam, remains on bullish path
  FxWirePro: EUR/NZD up trend gains momentum but hurdles ahead
  FxWirePro- Major Pair levels and bias summary
  AUDJPY Weakness Deepens: Sell Rallies Toward 112 as Aussie Dollar Falters
  GBPJPY Slips After Sterling Weakness, Bears Eye 216
  FxWirePro: NZD/USD edges lower, remains on back foot
  FxWirePro: GBP/NZD gains some ground but bias is still bearish
  FxWirePro: GBP/AUD under pressure as pound continues to weaken
  JPY Action Bias: USDJPY Emerges as the Clear Bullish Pair to Watch Amid Mixed Crosses
  FxWirePro : USD/JPY holds relatively bid on 163 ahead Of FOMC,BoJ meetings
  FxWirePro- Major Crypto levels and bias summary
  FxWirePro :USD/JPY eases slightly, remains on bullish path
  FxWirePro: USD/CAD gaining momentum for a move towards 1.4200 level
  FxWirePro: NZD/USD gains as U.S.-Iran peace hopes boost risk sentiment
  NZDJPY Action Bias: Bullish Dip-Buying Opportunity on Broad Yen Weakness


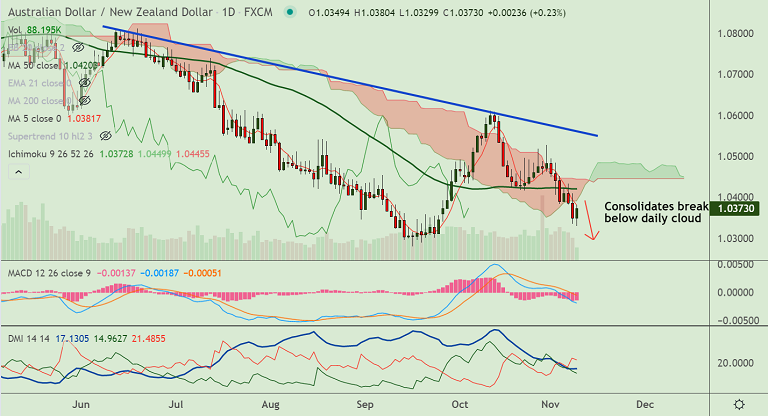
AUD/NZD chart - Trading View
Technical Analysis: Bias Bearish
- AUD/NZD was trading 0.22% higher on the day at 1.0372 at around 11:10 GMT.
- The pair is consolidating break below daily cloud, scope for further weakness.
- Momentum is strongly bearish, RSI is below 50, Stochs at oversold levels
- Volatility is high and MACD supports further downside in the pair
- Major moving averages are biased lower, GMMA indicator shows bias is strongly bearish
- 5-DMA is sharply lower and caps recovery attempts in the pair
Support levels - 1.0341 (Lower BB), 1.03, 1.0279 (16th Sept low)
Resistance levels - 1.0381 (5-DMA), 1.04, 1.0420 (50-DMA)
Summary: AUD/NZD trades with a bearish bias. Recovery attempts lack traction. Upside caped at 5-DMA. Scope for dip till 1.0250.


