


 FxWirePro: USD/ZAR firms ahead of Fed interest rate decision
  FxWirePro: GBP/AUD gains some upside momentum but still bearish
  FxWirePro: GBP/NZD maintains bersish bias with focus on 2.2900 level
  FxWirePro: USD/CAD slips after Fed holds rates steady
  FxWirePro: USD/JPY eases ahead of Fed decision , Intervention risks linger
  FxWirePro: GBP/USD edges lower ahead of Fed policy verdict
  FxWirePro: USD/ CNY remains soft ahead of Fed decision
  FxWirePro: NZD/USD neutral in the near-term, scope for downward resumption
  EURUSD Spikes to 1.14306 on Fed Pause as Traders Eye Sell-the-Rally Setup
  FxWirePro: GBP/AUD gains above 1.9200 level , upside pressure builds
  FxWirePro- Major Pair levels and bias summary
  FxWirePro- Major Pair levels and bias summary
  FxWirePro:EUR/NZD gains some upside momentum but still bearish
  FxWirePro- Major Crypto levels and bias summary
  EUR/JPY Holds Bullish Bias as Euro Extends Recovery
  JPY Pairs Action Bias: EURJPY Leads as Bullish Standout Amid Mixed Momentum
  FxWirePro: GBP/USD edges higher as traders await BoE guidance and UK fiscal clarity


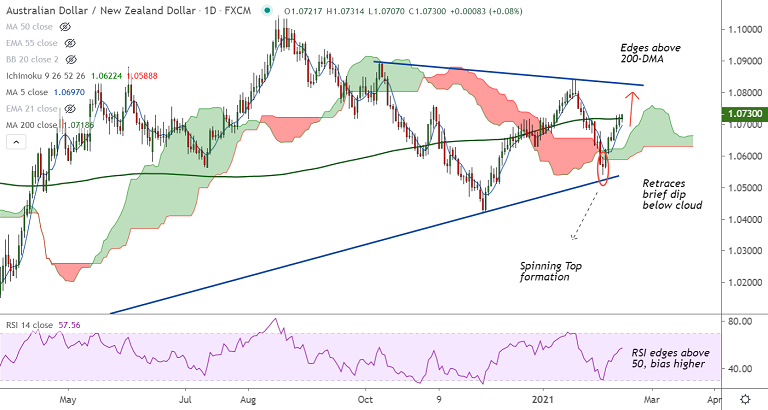
AUD/NZD chart - Trading View
AUD/NZD was trading 0.07% higher on the day at 1.0728 at around 05:45 GMT, bias higher.
The pair has edged above 200-DMA and close above will add to the bullish bias.
Momentum indicators are bullish with Stochs and RSI trending North and RSI edging above 50 mark.
Analysis of GMMA indicator shows near-term moving averages have crossed above long term moving averages.
Bullish 5-DMA crossover on 20-DMA supports bullish bias. Aussie also takes cues from Australia Treasury Secretary Kennedy's upbeat comments.
The pair has retraced dip below daily cloud with Spinning Top formation at lows. MACD shows a bullish crossover on signal line.
Support levels - 1.0679 (21-EMA), 1.0642 (200H MA), 1.06
Resistance levels - 1.0718 (200-DMA), 1.0759 (Nov 5th high), 1.08
Summary: AUD/NZD trades with a bullish bias. Watch out for close above 200-DMA for further gains. Next bull target lies at 1.0825 (major trendline resistance).


