


 Crypto Action Bias: ETHUSD Stands Out as the Bullish Pair to Watch
  FxWirePro- Major Crypto levels and bias summary
  NZD/JPY Flatlines Near 94.60: Will Key Support Reignite the Uptrend?
  FxWirePro: NZD/USD neutral in the near-term, scope for downward resumption
  JPY Pairs Action Bias: EURJPY Leads as Bullish Standout Amid Mixed Momentum
  EURUSD Spikes to 1.14306 on Fed Pause as Traders Eye Sell-the-Rally Setup
  FxWirePro: GBP/AUD gains some upside momentum but still bearish
  EUR/USD Bounces from Monthly Low, But Bearish Pressure Remains
  FxWirePro- Woodies pivot (Major)
  Buy the Dips on EUR/JPY: Bullish Structure Points to 188 Target Ahead of Fed
  FxWirePro: USD/CAD runs out of steam but maintains bullish outlook
  EUR/JPY Holds Bullish Bias as Euro Extends Recovery
  AUDJPY Weakness Deepens: Sell Rallies Toward 112 as Aussie Dollar Falters
  FxWirePro- Woodies pivot (Major)


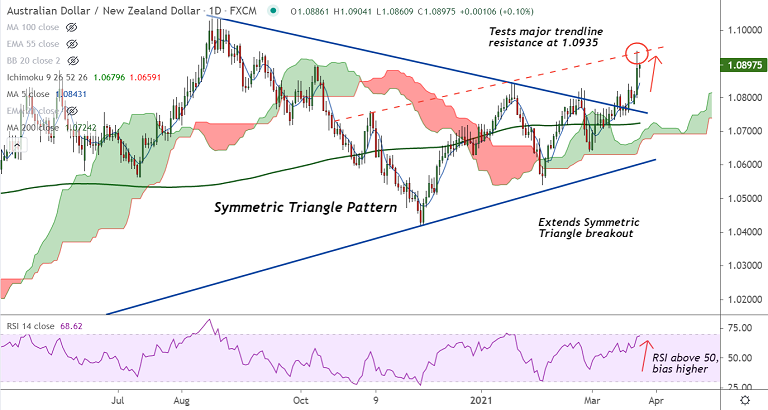
AUD/NZD chart - Trading View
AUD/NZD was trading 0.12% higher on the day at 1.0900 at around 04:45 GMT.
The pair is set to extend previous session's gains and is on track to refresh 6-month highs.
Technical indicators for the pair have turned bullish. The pair haudas ignored Doji on the previous week's candle and is over 0.90% higher for the week till date.
Analysis of GMMA indicator shows major and minor trend are bullish on the daily and weekly charts.
Volatility is rising as evidenced by widening Bollinger bands. MACD and ADX support upside in the pair.
Price action is extending Symmetric Triangle breakout and is testing major trendline resistance at 1.0935. Breakout will propel the pair higher.
Next major resistance lies at 110-month EMA at 1.0965. Failure to break above trendline resistance at 1.0935 dents upside.


