


 FxWirePro: GBP/NZD gains some ground but bias is still bearish
  FxWirePro: AUD/USD dips after RBA Governor speech
  FxWirePro : USD/JPY holds relatively bid on 163 ahead Of FOMC,BoJ meetings
  FxWirePro: GBP/USD edges higher as traders await BoE guidance and UK fiscal clarity
  Crypto Action Bias: ETHUSD Stands Out as the Bullish Pair to Watch
  JPY Action Bias: USDJPY Emerges as the Clear Bullish Pair to Watch Amid Mixed Crosses
  FxWirePro- Woodies pivot (Major)
  FxWirePro: EUR/ AUD gains some ground , but remains on bearish path
  AUDJPY Weakness Deepens: Sell Rallies Toward 112 as Aussie Dollar Falters
  FxWirePro: GBP/AUD gains some upside momentum but still bearish
  EUR/JPY Holds Bullish Bias as Euro Extends Recovery
  Major Forex Pairs Action Bias: GBPUSD and AUDUSD Turn Extremely Bearish
  FxWirePro- Major Pair levels and bias summary
  FxWirePro: EUR/AUD outlook weaker on renewed downside pressure
  FxWirePro: USD/CAD runs out of steam but maintains bullish outlook


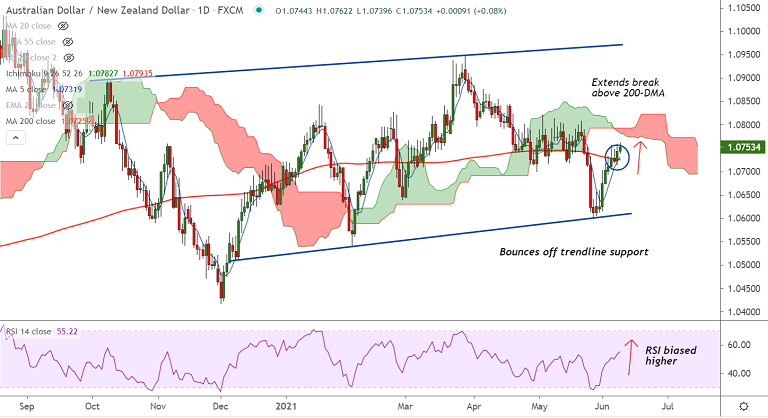
AUD/NZD chart - Trading View
Technical Analysis: Bias Bullish
- AUD/NZD was trading 0.08% higher on the day at 1.0752 at around 09:50 GMT
- The pair has shown a decisive break above 200-DMA, scope for further upside
- Momentum studies are bullish, Stochs and RSI are biased higher, RSI well above 50 mark
- Bullish 5-DMA crossover on 20-DMA adds to the upside bias
- GMMA indicator shows major trend is neutral, while minor trend is bullish
Fundamental Overview:
Mixed Chinese inflation data, US-Sino tussle and President Biden's infrastructure stimulus plans keep the antipodeans in check.
Data released earlier today showed China’s headline Consumer Price Index (CPI) eased to 1.3% YoY, missing expectations at 1.6%.
On the other side, China Producer Price Index (PPI) jumped the highest since 2008 while marking a 9.0% rally versus 8.5% expected.
Earlier in the day, Australia’s Westpac Consumer Confidence for June dropped below -4.8% previous readouts to -5.2%.
Also, reports that China is mulling price controls on coal prices keeps the commodity currencies depressed.
Support levels - 1.0740 (110-EMA), 1.0731 (5-DMA), 1.0725 (200-DMA)
Resistance levels - 1.0782 (Cloud base), 1.0822 (23.6% Fib), 1.0951 (110-month EMA)
Summary: AUD/NZD has shown a decisive break above 200-DMA, raising scope for further upside. Bulls target daily cloud. Breakout above cloud will propel the pair higher. Weakness only on retrace below 200-DMA.


