


 FxWirePro: USD/ZAR retreats but trend is still bullish
  JPY Action Bias: USDJPY Emerges as the Clear Bullish Pair to Watch Amid Mixed Crosses
  FxWirePro: EUR/NZD up trend gains momentum but hurdles ahead
  FxWirePro: AUD/USD falls after softer-than-expected Australian Q2 CPI
  FxWirePro: EUR/AUD outlook weaker on renewed downside pressure
  FxWirePro: NZD/USD neutral in the near-term, scope for downward resumption
  FxWirePro: EUR/ AUD gains some ground , but remains on bearish path
  FxWirePro- Major Pair levels and bias summary
  FxWirePro: NZD/USD edges lower, remains on back foot
  AUDJPY Weakness Deepens: Sell Rallies Toward 112 as Aussie Dollar Falters
  Crypto Action Bias: ETHUSD Stands Out as the Bullish Pair to Watch
  FxWirePro: USD/JPY eases ahead of Fed decision , Intervention risks linger
  EUR/JPY Holds Bullish Bias as Euro Extends Recovery
  JPY Pairs Action Bias: EURJPY Leads as Bullish Standout Amid Mixed Momentum
  NZD/JPY Flatlines Near 94.60: Will Key Support Reignite the Uptrend?
  EUR/USD Bounces from Monthly Low, But Bearish Pressure Remains


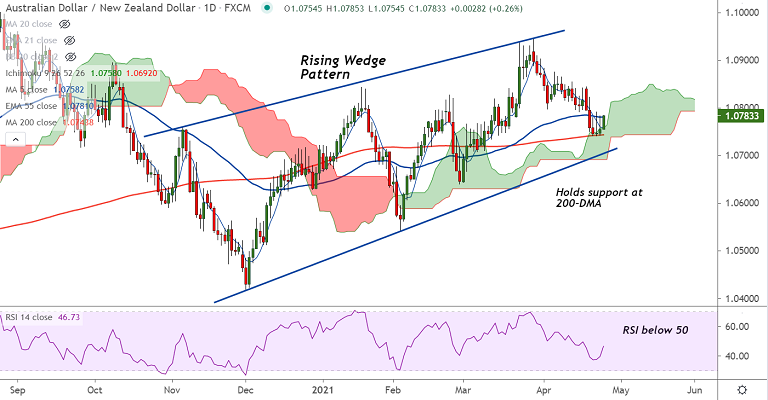
AUD/NZD chart - Trading View
Technical Analysis: Bias turning bullish
- Price action has shown a bounce off 200-DMA and cloud support
- GMMA indicator shows short-term trend is turning bullish, major trend is neutral
- RSI has turned and Stochs are on verge of rollover from oversold levels
- Price action is within a rising wedge pattern and bounce off 200-DMA keeps scope for upside resumption
- The pair is attempting break above 55-EMA which will fuel further gains
Support levels - 1.0781 (55-EMA), 1.0759 (5-DMA), 1.0743 (200-DMA)
Resistance levels - 1.0798 (21-EMA), 1.0813 (20-DMA), 1.0961 (110-month EMA)
Summary: AUD/NZD finds major support at 200-DMA, any further weakness only on break below. Decisive break above 55-EMA will confirm upside resumption.


