


 FxWirePro: GBP/AUD downside pressure builds, key support level in focus
  FxWirePro: USD/CAD gaining momentum for a move towards 1.4200 level
  FxWirePro: AUD/USD dips after RBA Governor speech
  FxWirePro: GBP/USD edges higher as traders await BoE guidance and UK fiscal clarity
  AUDJPY Weakness Deepens: Sell Rallies Toward 112 as Aussie Dollar Falters
  EUR/JPY Holds Bullish Bias as Euro Extends Recovery
  FxWirePro- Major Crypto levels and bias summary
  FxWirePro: EUR/NZD up trend gains momentum but hurdles ahead
  FxWirePro: USD/ZAR uptrend loses steam, remains on bullish path
  FxWirePro- Major Pair levels and bias summary
  FxWirePro: GBP/NZD gains some ground but bias is still bearish
  Major Pairs Action Bias: USDCAD and USDCHF Stand Out as Extremely Bullish While GBPUSD and NZDUSD Turn Extremely Bearish
  FxWirePro- Major Pair levels and bias summary
  EUR/USD Bounces from Monthly Low, But Bearish Pressure Remains
  FxWirePro: EUR/ AUD gains some ground , but remains on bearish path
  FxWirePro- Woodies pivot (Major)


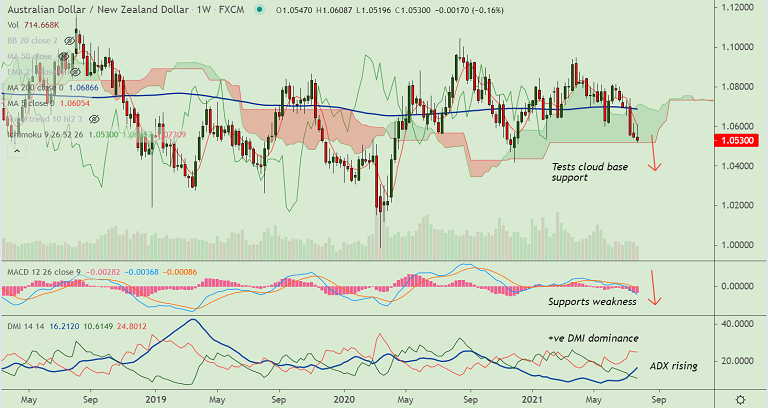
AUD/NZD chart - Trading View
Technical Analysis: Bias Bearish
- AUD/NZD was trading 0.10% lower on the day at 1.0530 at around 12:25 GMT
- Volatility is high and rising on the daily and weekly charts as evidenced by widening Bollinger bands
- GMMA indicator shows major and minor trend are strongly bearish on the daily charts
- MACD is well below zero and ADX is rising in support of downside
- The pair hovers around weekly cloud base support, breach below will plummet prices
- A potential 'Death Cross' (bearish 50-DMA crossover on 200-DMA) keeps bias bearish
Support levels - 1.0517 (Weekly cloud base), 1.0483 (Lower BB), 1.0418 (Dec 2020 lows)
Resistance levels - 1.0552 (5-DMA), 1.0606 (21-EMA), 1.0670 (55-EMA)
Summary: AUD/NZD trades with a bearish bias. Price action is pivotal at weekly cloud support. Break below will plummet prices.


