


 GBPJPY Slips After Sterling Weakness, Bears Eye 216
  FxWirePro- Woodies pivot (Major)
  AUDJPY Weakness Deepens: Sell Rallies Toward 112 as Aussie Dollar Falters
  EUR/JPY Holds Bullish Bias as Euro Extends Recovery
  EUR/USD Bounces from Monthly Low, But Bearish Pressure Remains
  FxWirePro: GBP/NZD gains some ground but bias is still bearish
  FxWirePro: USD/ZAR retreats but trend is still bullish
  FxWirePro- Major Crypto levels and bias summary
  FxWirePro: NZD/USD edges lower, remains on back foot
  FxWirePro: EUR/AUD outlook weaker on renewed downside pressure
  FxWirePro: AUD/USD dips after RBA Governor speech
  JPY Action Bias: USDJPY Emerges as the Clear Bullish Pair to Watch Amid Mixed Crosses
  Major Pairs Action Bias: USDCAD and USDCHF Stand Out as Extremely Bullish While GBPUSD and NZDUSD Turn Extremely Bearish
  FxWirePro: USD/CAD gaining momentum for a move towards 1.4200 level
  FxWirePro : USD/JPY holds relatively bid on 163 ahead Of FOMC,BoJ meetings
  FxWirePro- Major Pair levels and bias summary


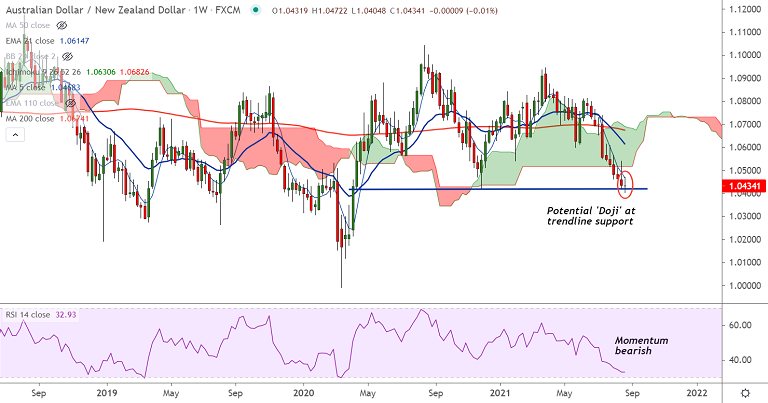
AUD/NZD chart - Trading View
Technical Analysis: Bias Bearish
- AUD/NZD is on track to close the week with a Doji formation at major trendline support, bearish bias remains intact
- Price action has paused 6 week's bearish streak and is holding above major trendline support at 1.0420
- A potential Doji formation on the weekly candle shows bears struggling to take prices lower
- GMMA indicator shows major and minor trend are strongly bearish on the daily and weekly charts
- Price action is below daily cloud and major moving averages, momentum indicators support weakness
- MACD is well below the zero mark and ADX supports downside. Oscillator are at oversold levels which warrants some caution.
Support levels - 1.0420 (trendline), 1.0396 (Lower W BB), 1.0307 (Jan 2020 low)
Resistance levels - 1.0466 (20-DMA), 1.0475 (21-EMA), 1.05 (Psychological mark)
Summary: AUD/NZD trades with a major bearish bias. Some pullbacks likely on account of oversold conditions. The pair is hovering around major trendline support at 1.0420.
A potential 'Doji' formation on the week candle suggests indecision. Recovery attempts lack traction. Decisive break above 21-EMA could change near-term dynamics. Break below 1.0420 will plummet prices.


