


 EUR/JPY Holds Bullish Bias as Euro Extends Recovery
  FxWirePro: AUD/USD falls after softer-than-expected Australian Q2 CPI
  FxWirePro : USD/JPY holds relatively bid on 163 ahead Of FOMC,BoJ meetings
  EUR/USD Bounces from Monthly Low, But Bearish Pressure Remains
  FxWirePro: EUR/AUD outlook weaker on renewed downside pressure
  FxWirePro- Major Pair levels and bias summary
  FxWirePro: GBP/AUD downside pressure builds, key support level in focus
  FxWirePro: GBP/AUD gains some upside momentum but still bearish
  FxWirePro: GBP/USD edges higher as traders await BoE guidance and UK fiscal clarity
  FxWirePro: EUR/NZD up trend gains momentum but hurdles ahead
  Major Pairs Action Bias: USDCAD and USDCHF Stand Out as Extremely Bullish While GBPUSD and NZDUSD Turn Extremely Bearish
  Crypto Action Bias: ETHUSD Stands Out as the Bullish Pair to Watch
  FxWirePro: USD/JPY eases ahead of Fed decision , Intervention risks linger
  FxWirePro: USD/ZAR uptrend loses steam, remains on bullish path
  FxWirePro- Woodies pivot (Major)
  NZDJPY Pullback: Sell Rallies Toward 93.30 as Yen Weakness Eases
  FxWirePro: EUR/ AUD gains some ground , but remains on bearish path


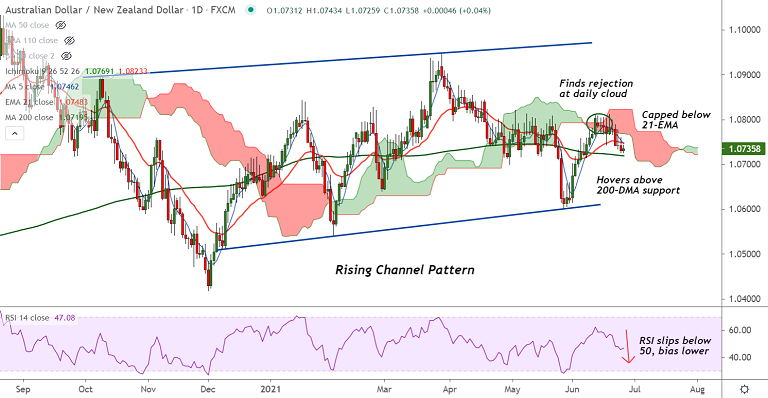
AUD/NZD chart - Trading View
Technical Analysis: Bias Bearish
- AUD/NZD was trading largely unchanged on the day at 1.0733 at around 12:20 GMT
- Recovery attempts were capped at 5-DMA, pair has formed a spinning top on the daily candle at the time of writing
- 5-DMA is biased lower, price action is hovering above 200-DMA support, break below will see further downside
- Stochs and RSI are biased lower, momentum is bearish, volatility is high as evidenced by wide Bollinger bands
- MACD shows bearish crossover on signal line, adding to the downside bias
Support levels - 1.0719 (200-DMA), 1.07 (Psychological mark), 1.0682 (50% Fib)
Resistance levels - 1.0746 (21-EMA), 1.0768 (200H MA), 1.0823 (Cloud top)
Summary: AUD/NZD recovery attempts capped at 5-DMA. The pair is hovering above 200-DMA support at 1.0719. Breach below 200-DMA will open further downside.


