
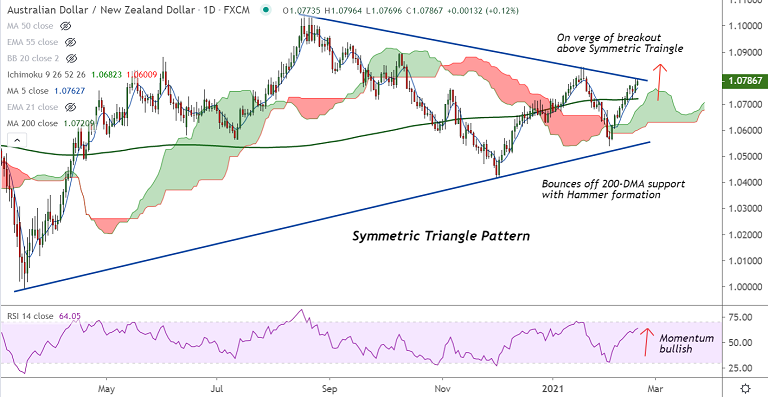
AUD/NZD chart - Trading View
Technical Analysis: Bias Bullish
- AUD/NZD was trading 0.08% higher on the day at 1.0781 at around 10:00 GMT
- The pair is extending bounce off 200-DMA support, Hammer formation at 200-DMA reinforces upside
- Momentum is strongly bullish, Stochs and RSI are sharply higher. RSI is at 63 which extends strong support to the current uptrend
- GMMA shows minor trend is strongly bullish, while major trend is turning bullish
- MACD and ADX support the bullish bias, Supertrend indicator also suggests a Buy signal
- Price action is on verge of Symmetric Triangle breakout, confirmation will buoy bulls in the pair
Support levels - 1.0761 (5-DMA), 1.0720 (200-DMA), 1.0711 (21-EMA)
Resistance levels - 1.08 (Trendline), 1.0843 (Jan 2021 high), 1.0968 (110 month EMA)
Summary: AUD/NZD trades with a strong bullish bias. The pair currently is testing Symmetric Triangle top at 1.08. Break above will propel the pair higher. Bullish invalidation only below 200-DMA.


