


 FxWirePro- Woodies pivot (Major)
  FxWirePro: GBP/USD edges lower ahead of Fed policy verdict
  FxWirePro: AUD/USD falls after softer-than-expected Australian Q2 CPI
  NZD/JPY Flatlines Near 94.60: Will Key Support Reignite the Uptrend?
  FxWirePro: NZD/USD firms as Kiwi gains on strong ANZ business outlook data
  FxWirePro: NZD/USD neutral in the near-term, scope for downward resumption
  EURUSD Spikes to 1.14306 on Fed Pause as Traders Eye Sell-the-Rally Setup
  FxWirePro:EUR/NZD gains some upside momentum but still bearish
  FxWirePro: USD/ CNY remains soft ahead of Fed decision
  FxWirePro- Woodies pivot (Major)
  Major Forex Pairs Action Bias: GBPUSD and AUDUSD Turn Extremely Bearish
  FxWirePro: AUD/USD dips below lower range, bearish bias increases
  FxWirePro: GBP/AUD gains some upside momentum but still bearish
  FxWirePro : GBP/NZD strongly bearish despite upside attempts
  FxWirePro: USD/ZAR firms ahead of Fed interest rate decision


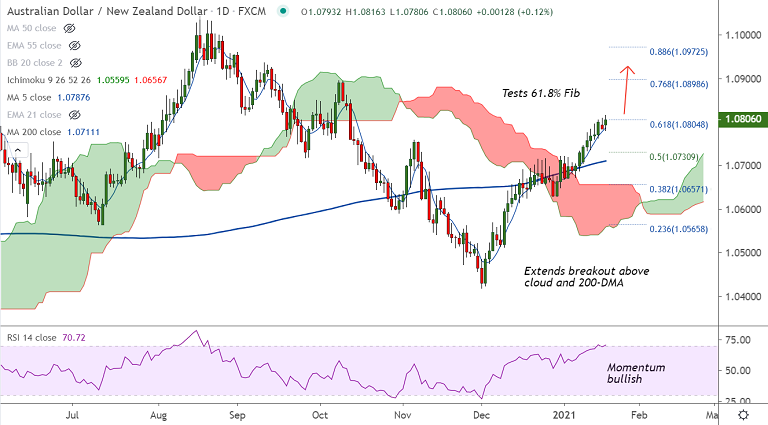
AUD/NZD chart - Trading View
Technical Analysis: Bias Bullish
- Price has edged above cloud and major moving averages
- Bollinger bands are widening, suggests rising volatility
- Oscillators (Stochs and RSI) show momentum is strongly bullish
- Analysis of GMMA indicator shows minor trend is bullish, while major trend is turning bullish
- MACD and ADX also support upside, MACD shows bullish crossover on signal line on the weekly charts
Support levels - 1.0788 (5-DMA), 1.0752 (200H MA), 1.0730 (50% Fib)
Resistance levels - 1.0865 (Nov 2019 high), 1.0898 (76.8% Fib), 1.09
Summary: Aussie remains bid across the board after upbeat Australian data. Risk-on mood also supports antipodeans. AUD/NZD trades with a strong bullish bias. Price action has edged above 61.8% Fib and is on track to test 76.8% Fib at 1.0898.


