
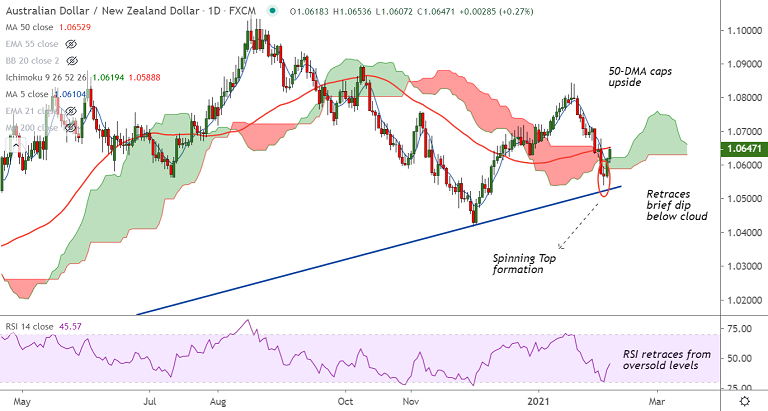
AUD/NZD chart - Trading View
AUD/NZD was trading 0.27% higher on the day at 1.0646 at around 12:20 GMT, bias is turning bullish.
The pair has bounced off multi-week lows with a spinning top formation and is extending gains for the 2nd straight session.
Price action has retraced above daily cloud, but is capped below 50-DMA resistance at 1.0652. Decisive break above will fuel further gains.
On the weekly charts, the pair has formed a Dragonfly Doji pattern which suggests buying pressure at lows.
Stochs and RSI are showing a bullish rollover from oversold levels and 5-DMA has halted the decline to turn flat.
Break above 50-DMA finds a series of resistances aligned at 55-EMA (1.0675), 110-EMA (1.0680) and 200-DMA (1.0716).
Breakout at 200-DMA will confirm upside for the pair. On the flipside, break below cloud will negate any upside bias.


