


 Buy the Dips on EUR/JPY: Bullish Structure Points to 188 Target Ahead of Fed
  FxWirePro: GBP/AUD gains some upside momentum but still bearish
  NZDJPY Bullish Rebound: Buy Dips as EMAs Align for 97 Target
  NZD/JPY Flatlines Near 94.60: Will Key Support Reignite the Uptrend?
  FxWirePro- Major Crypto levels and bias summary
  FxWirePro: USD/ZAR firms ahead of Fed interest rate decision
  Major FX Action Bias & US Market Sentiment: NZD/USD (Extremely Bullish) & AUD/USD (Bullish) Watchlist
  FxWirePro: GBP/USD edges lower ahead of Fed policy verdict
  FxWirePro: USD/ CNY remains soft ahead of Fed decision
  JPY Action Bias: EURJPY and CADJPY Emerge as Extremely Bullish Pairs to Watch
  FxWirePro- Woodies pivot (Major)
  FxWirePro: EUR/AUD regains upwards momentum but unable to hold above 50%fib level
  Major Forex Pairs Action Bias: GBPUSD and AUDUSD Turn Extremely Bearish
  FxWirePro: NZD/USD neutral in the near-term, scope for downward resumption
  FxWirePro: GBP/NZD maintains bersish bias with focus on 2.2900 level
  FxWirePro: USD/JPY eases ahead of Fed decision , Intervention risks linger
  FxWirePro- Major Pair levels and bias summary


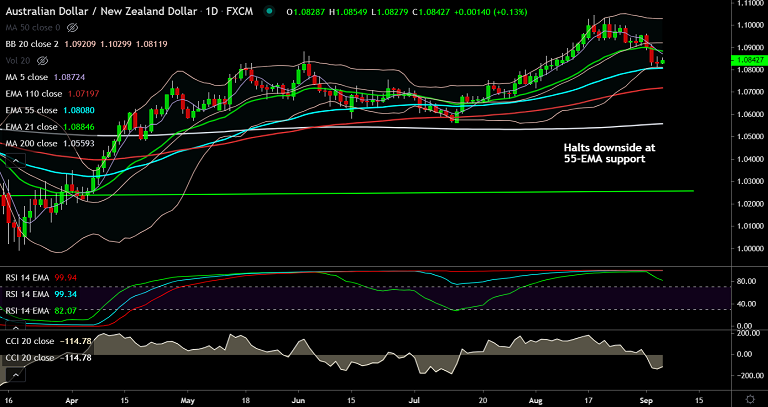
AUD/NZD chart - Trading View
Technical Analysis: Bias Neutral
GMMA Indicator
- Daily charts: Minor trend bearish; Major trend bullish
- Weekly charts: Minor trend bearish; Major trend bullish
Ichimoku Analysis
- Price action is above cloud on daily and weekly charts
- Chikou span shows some weakness on the weekly charts
Oscillators
- Oscillators show bearish momentum on the daily and weekly charts
Bollinger Bands
- Price action has bounced off lower Bollinger band on the daily charts, volatility is high
- Price action capped at upper Bollinger Band on the weekly charts, resumption of upside likely
Major Support Levels: 1.0808 (55-EMA), 1.0719 (110-EMA), 1.0559 (200-DMA)
Major Resistance Levels: 1.0884 (21-EMA), 1.0903 (5W MA), 1.0921 (20-DMA)
Summary: AUD/NZD price action has halted downside at 55-EMA support. 'Spinning Top' at lows on the previous session's candle shows seller hesitation to drag prices lower. Price action currently grinding sideways at 55H EMA resistance. Break above will see upside. Long positions advised only on decisive break above 21-EMA.


