


 JPY Pairs Action Bias: EURJPY Leads as Bullish Standout Amid Mixed Momentum
  FxWirePro: GBP/NZD maintains bersish bias with focus on 2.2900 level
  NZD/JPY Flatlines Near 94.60: Will Key Support Reignite the Uptrend?
  AUDJPY Weakness Deepens: Sell Rallies Toward 112 as Aussie Dollar Falters
  FxWirePro- Woodies pivot (Major)
  FxWirePro- Woodies pivot (Major)
  Crypto Action Bias: ETHUSD Stands Out as the Bullish Pair to Watch
  EUR/JPY Holds Bullish Bias as Euro Extends Recovery
  FxWirePro: USD/JPY eases ahead of Fed decision , Intervention risks linger
  FxWirePro: GBP/AUD gains some upside momentum but still bearish
  EURUSD Spikes to 1.14306 on Fed Pause as Traders Eye Sell-the-Rally Setup
  FxWirePro: GBP/USD edges higher as traders await BoE guidance and UK fiscal clarity
  FxWirePro: USD/ZAR firms ahead of Fed interest rate decision
  FxWirePro- Major Pair levels and bias summary
  FxWirePro: USD/ CNY remains soft ahead of Fed decision


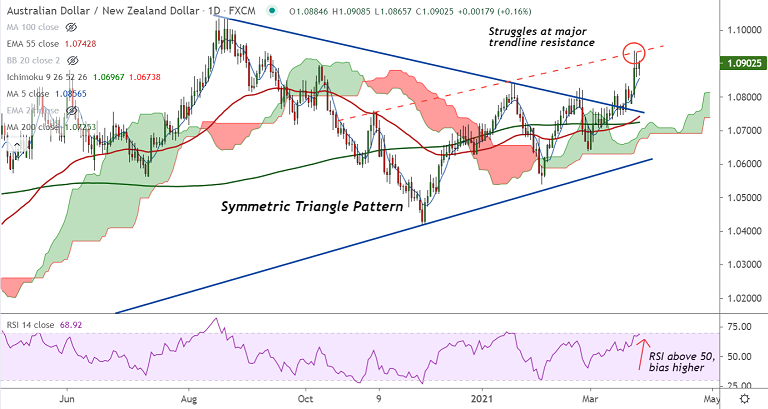
AUD/NZD chart - Trading View
AUD/NZD was trading 0.15% higher on the day at 1.0900 at around 13:55 GMT.
The pair has ignored Doji formation on the previous day's candle and is extending grind higher.
Technical indicators for the pair have turned bullish after breakout of Symmetric Triangle pattern.
Analysis of GMMA indicator shows major and minor trend are bullish on the daily and weekly charts.
Volatility is rising as evidenced by widening Bollinger bands. MACD and ADX support upside in the pair.
Antipodeans buoyed after AstraZeneca confirmed the efficacy of its vaccines to combat the coronavirus (COVID-19) and its variants during the phase 3 trials.
Official updates from the pharma major confirmed 100% efficacy against severe and critical disease as well as 85% efficacy for those aged 65+.
| Support | 1.0855 (5-DMA) | 1.0821 (200H MA) |
| Resistance | 1.0965 (110-month EMA) | 1.1043 (2020 high) |
Summary: Price action is currently struggling at major trendline resistance at 1.0935. Breakout will propel the pair higher.
Next major resistance lies at 110-month EMA at 1.0965. Failure to break above trendline resistance dents upside.


