
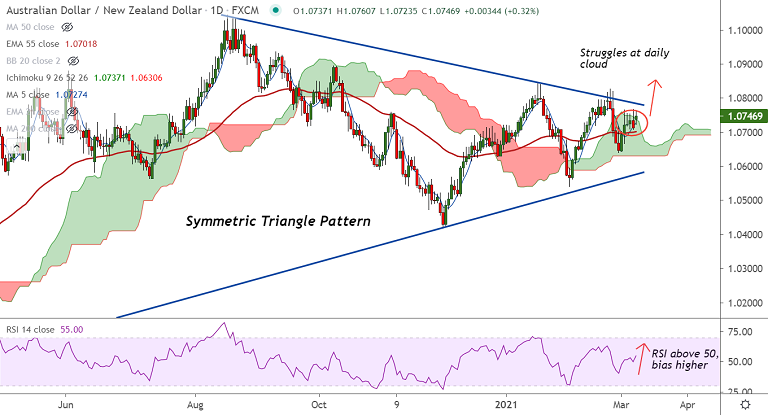
AUD/NZD chart - Trading View
Technical Analysis: Bias Bullish
- AUD/NZD was trading 0.34% higher on the day at 1.0748 at around 09:10 GMT
- The pair is struggling to breakout of daily cloud from the past few sessions
- Price action is consolidating above 200-DMA and bias bullish as long as 200-DMA support holds
- RSI is above 50 and supports the current uptrend, Stochs are also biased north
- GMMA indicator shows near-term trend is bullish, while major trend is neutral
Support levels - 1.0719 (200-DMA), 1.0701 (55-EMA), 1.0630 (cloud base)
Resistance levels - 1.0785 (Trendline), 1.08, 1.0827 (Feb 23 high)
Summary: AUD/NZD is extending sideways at cloud top resistance. Breakout of cloud will see test of next major resistance at Triangle Top 1.0785. Symmetric Triangle breakout will propel the pair higher.


